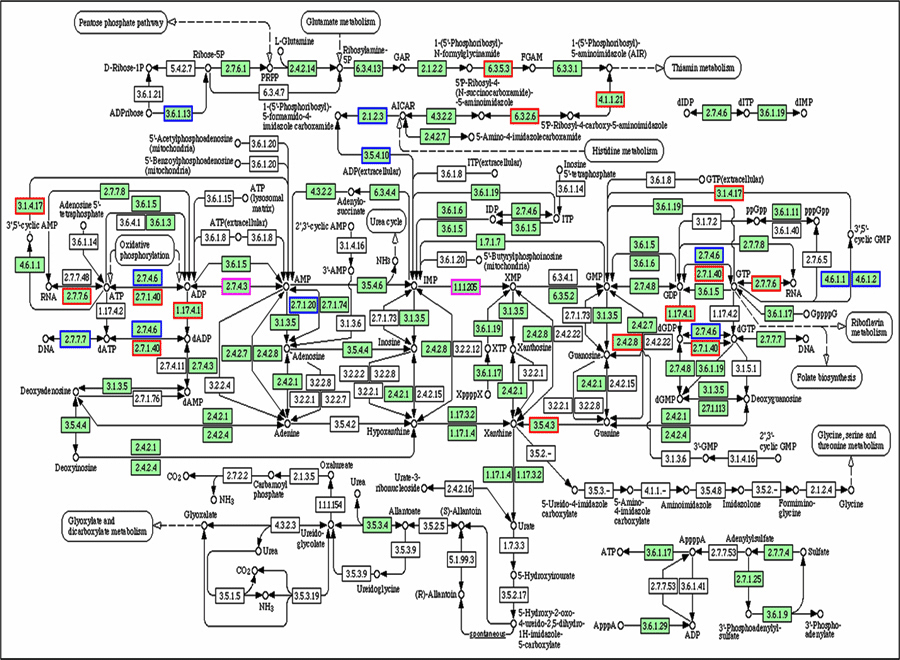
Figure 4: Differentially expressed enzymes in purine metabolism identified from irradiated AT5BIVA and ATCL8 cells.
Enzyme Commission numbers (EC#, e.g. 1.17.4.1)
are used to represent enzymes in metabolism. Highlighted in green background are known human enzymes annotated in the KEGG database. Differentially expressed enzymes
in purine metabolism (Table 3) are superimposed onto this pathway diagram: blue-boxed are enzymes changed in AT5BIVA cells, red-boxed those in ATCL8 cells, and pinkboxed
those from both cells. Areas circled with broken lines highlight closely related biochemical steps surrounding ADP/ATP (left) or GDP/GTP (right) metabolisms, which
include most of these differentially expressed enzymes from either cell type.