Analysis of Future Climate Scenarios over Central Uganda Cattle Corridor
Received: 16-Sep-2014 / Accepted Date: 05-Nov-2014 / Published Date: 15-Nov-2014 DOI: 10.4172/2157-7617.1000237
Abstract
The study employed a Regional Climate Model (RCM), Providing Regional Climates for Impact Studies (PRECIS), to examine the future climate scenarios over the central Uganda cattle corridor districts of Nakaseke and Nakasongola in the near future (2021-2050) and mid-century (2051-2080). The study was guided by two questions: what are the projected temperature and rainfall values for the central Uganda cattle corridor in relation to IPCC Special Report on Emission Scenarios (SRES) A2 and A1B Scenarios for the same periods; how do they compare with the new set of scenarios known as Representative Concentration Pathways (RCPs) in the same area for the same period? The scenarios were obtained using PRECIS software and delta methods using R software according to the AGMIP protocols for SRES and RCP; respectively. Results show both SRES A2 and A1B projecting temperature increases in average monthly, seasonal as well as annual for both near future and mid centuryperiods with A2 showing a mean annual temperature increase of 2.5 to 4.4°C in the near future and 4.5 to 6.0°C in the mid century relative to the 1981-2010 average compared to A1B which shows annual temperature increase of 0.7 -1.7°C in the near future and 1.7-3.5°C in the far future. The same trend is observed for RCP 4.5 and RCP 8.5 but the increments are lower for the RCPs compared to the SRES. Projections for rainfall show a slight increase in annual rainfall in both SRES and RCPs. However more rainfall is projected for the second rainfall season of September to November compared to the usual known season of March to May (MAM). The projections also show a shift in rainfall with the usual dry season of December to February (DJF) now becoming wetter than the 1980-2010 average. This shift is consistent in all the scenarios and has also been observed in other studies done in the region. From the results farmers should be advised to take advantage of the projected increases in rainfall especially.
Keywords: Climate change; PRECIS; Uganda cattle corridor; Projections; Dry spells
Introduction
Climate change and variability are now recognized environmental global problems affecting mankind. Climate related risks due to increased variations in climate and weather associated with extreme events have emerged as a key natural hazard of the 21st Century. Most socio-economic sectors such as; settlements, agriculture, transport, and energy among others is highly sensitive to these climate risks.
Studies on both present-day climate variability and future climate change scenarios available today for assessing Climate change impacts, vulnerability and adaptation have predominantly been derived from Global Circulation model (GCM) outputs [1,2]. This information from GCMs may not be realistic for regional/national climate change impacts, adaptation and vulnerability assessments because of the high level of uncertainty in GCM simulations due to their coarse grid resolution and the misrepresentation of local and meso-scale climate and hydrological processes. Such processes include; convection (moisture transport), topography (terrain) and land cover/use changes, effect of inland water bodies (breezes) and other local climate drivers. Down scaling of GCMs is therefore essential and has been found to reduce the above associated problems [3]. Two main techniques of statistical and dynamical downscaling are normally used in climate research. Dynamical downscaling involves nesting a Regional Climate Model (RCM) into a GCM which provides boundary as well as lateral initial conditions [4]. Dynamical downscaling can simulate local feedback features which may not be captured by statistical methods however it requires strong computing resources [4]. Statistical downscaling on the other hand involves finding statistical relationships between global scale features from GCMs and fine scale climate for a particular location which requires less computing resources and may be used to supplement dynamical downscaling [5].
This study employed a Regional Climate Model Providing Regional Climates for Impact Studies (PRECIS) [6] to examine the future climate scenarios over the central Uganda cattle corridor districts of Nakaseke and Nakasongola in the near future (2021-2050) and far future (2051- 2080). The study was guided by two questions (1) what are the projected temperature and rainfall values for the central Uganda cattle corridor in relation to Inter-governmental Panel on Climate Change (IPCC) Special Report on Emission Scenarios (SRES) A2 and A1B Scenarios [7] for the near future (2021-2050) and far future (2051-2080)? (2) How do these projections compare with the new set of scenarios known as Representative Concentration Pathways (RCPs) [8] in the same area for the same period?
Materials And Methods
Study area
Nakaseke and Nakasongola are located in the central corridor districts of Uganda (Figure 1). The area experiences a bi modal rainfall season like most parts of the country with the first season beginning in March and ending in early June and the second season beginning in late August/ early September and ends in November/December. The daily maximum temperature range from 25-35°C, while the daily minimum range from 18-25°C throughout the year.
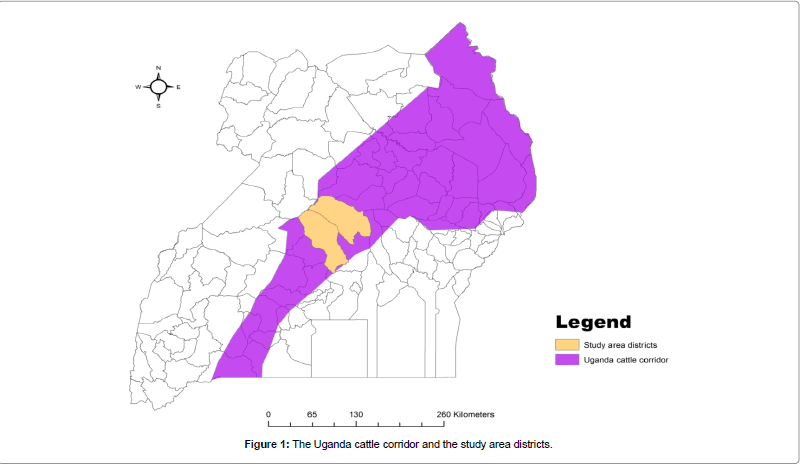
Figure 1: The Uganda cattle corridor and the study area districts.
Climate scenarios
The Intergovernmental Panel on Climate Change (IPCC) defines a scenario as ‘a plausible and often simplified description of how the future may develop, based on a coherent and internally consistent set of assumptions about driving forces and key relationships. Previously the SRES [7] have been extensively used in climate change research and assessments. The SRES were based on narrative storylines that conveyed the overall logic underlying the related quantitative descriptions of future economic, demographic, technology, and emissions trends. The SRES consist of approximately 40 scenarios aggregated into four divergent families or story lines. The first story line is A1 which assumes a future rapid economic growth, rapid introduction of new and more efficient technologies. The A1 is further divided into three categories distinguished by their technological emphasis that is fossil intensive (A1FI), non-fossil energy sources (A1T), or a balance across all source (A1B). The second story line is A2 that assumes a future with heterogeneous world with ever-increasing global population and regionally oriented economic growth. In A2 economic development is primarily regionally oriented and per capita economic growth and technological change are more fragmented and slower than in other storylines. The third story line is B1 that assumes a future that is geared towards a globalized service and information economy and the introduction of clean and resource-efficient technologies. The emphasis in B1 is on global solutions to economic, social, and environmental sustainability, including improved equity, but without additional climate initiatives. The final story line is B2 that describes a future world whose focus is on local solutions for sustainability and social equity with intermediate economic development. It assumes a world with continuously increasing global population at a rate lower than A2, intermediate levels of economic development, and less rapid and more diverse technological change than in the B1 and A1 storylines.
A new set of scenarios known as Representative Concentration Pathways (RCPs) have been adopted by climate researcher’s to provide plausible future evolution of the atmospheric composition [8]. The RCPs complement and for some purposes replace the SRES scenarios in climate change assessments. The new advances in climate models have led to a need for more detailed scenario information than was provided by SRES for example aerosol emissions, geographically explicit descriptions of land use and emissions and detailed specification of emissions by source type and these RCPs have been used to drive climate model simulations of the World Climate Research program, in the Fifth Couple Model Intercomparision Project (CMIP5) whose results are the only acceptable as official climate projections by IPCC. Four categories of RCPs have been developed following possible trajectories for future greenhouse concentration. The first scenario is RCP 8.5 which is a high emission scenarios with ever increasing emissions to a radiative forcing of greater than 8.5 Wm-2 by the year 2100 [9]. The second is RCP 6.5 which is also a high emission scenario with emissions stabilizing at a radiative forcing of 6 Wm-2 after the year 2100 [10]. The third scenario is RCP 4.5 which is an intermediate scenario with emissions stabilizing at a radiative forcing of 4.5 Wm-2 after the year 2100 [11]. The final scenario is RCP 2.6 (RCP3-PD) which is a low emission scenario where emissions peak at a radiative forcing of 3Wm-2 before the year 2100 and then decline after words [12].
Climate modeling
This involved the use of a Regional Climate Model (RCM) Providing Regional Climates for Impact Studies (PRECIS) for down scaling outputs of the General Circulation Models. The PRECIS RCM was validated over the East African Region by Lucinda [13] and over the Lake Victoria basin by Sabiiti [14] and has been found to capture well the climatology patterns like the movement of the Inter Tropical Convergence Zone (ITCZ).
PRECIS is a PC based Regional Climate Model (RCM) with a friendly and interactive graphical user interface GUI (Figure 2). It is a high resolution atmosphere and land surface model that can be nested over a limited area in a Global Circulation Model (GCM). The model was developed by the UK Met Office Hadley Centre and it incorporates the current version of the HadRCM3H RCM which has similar dynamics and physics as the Hadley Centre Coupled Model (HadCM3) GCM. The detailed dynamics, physics and other characteristics of the PRECIS RCM can be found in Jones et al. [6].
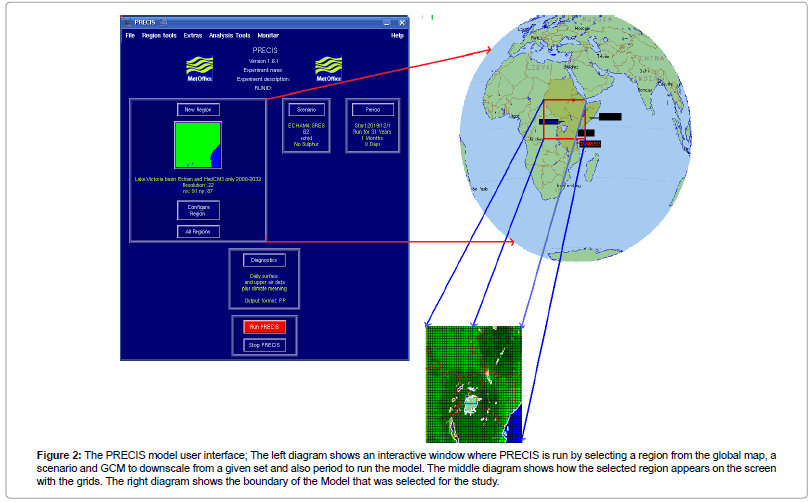
Figure 2: The PRECIS model user interface; The left diagram shows an interactive window where PRECIS is run by selecting a region from the global map, a scenario and GCM to downscale from a given set and also period to run the model. The middle diagram shows how the selected region appears on the screen with the grids. The right diagram shows the boundary of the Model that was selected for the study.
The PRECIS RCM was run at a horizontal resolution of 0.22° × 0.22° resolution which gives grid boxes of about 25 km × 25 km The PRECIS model requires prescribed surface and lateral boundary conditions to run. The model inputs include; Sea Surface Temperature (SSTs) and sea ice generated from various GCMs, Mean Sea Level Pressure (MSLP), Horizontal wind components, Temperature and Humidity. The model was run with input data sets of European Centre Hamburg Atmospheric Model (ECHAM4) A2 scenario experiments 1960-2100 and HadCM3 Qump project 1950-2099 and these data sets were obtained from the UK Met Office, the model developers.
Future projections over the Uganda cattle corridor were simulated using scenarios developed by the IPCC working group III [15]. Scenarios for A2 and A1Bwere used analyzed for the near future (2021- 2050) and far future (2051-2080) following World Meteorological Organization (WMO) climate periods. The scenarios were chosen because of the availability of boundary data.
The out puts of the model range from hourly to decadal time scales in PP, Grib and Netcdf formats. For this study the out puts of interest were projected daily, monthly and seasonal climatic parameters of precipitation, maximum and minimum temperatures
The model outputs were analyzed using a number of software such as Visual Climate Data Analysis Tool (VCDAT), XCONV and the Grid Analysis and Display System (GrADS) to produce spatial maps showing the climate projections of various climatic parameters of interest.
In addition RCPs were also considered during this study. Future scenarios were generated using the delta method which involves combining low resolution (GCM) output to high resolution (observations) of the present day base-line climate [5]. 20 GCMs from different global climate modeling centers used in CMIP5 were downscaled for the study area for RCP 8.5 and RCP 4.5 in the two climate periods. The scenarios were chosen because of availability of data and the computing resources available.
Projections for temperature and rainfall, the key main climatic parameters were considered in this study. Seasonal rainfall projections were analyzed as well as monthly and seasonal temperature projections for the study area. Spatial maps have been produced for the two climate periods (near future and far future) for both temperature and rainfall. The SRES projections have been compared with RCPs projections and the detailed are presented in the subsections below.
Analysis was done for the two major rainfall seasons of March to May (MAM) and September to November (SON) as well as the two dry seasons of June to August (JJA) and December to February (DJF) in the study area [16] using SRES A2 and A1B scenarios for the near future (2021-2050) and far future (2051-2080).
Results
Seasonal rainfall
MAM: A2 scenario projects a total seasonal rainfall of between 200-250 mm for most parts of the study area in the near future apart from the few places near lake Kyoga in the north eastern part of the study area where MAM rainfall is projected to be near 300 mm. The same pattern is observed in the study area in the far future climate period (Figure 3).
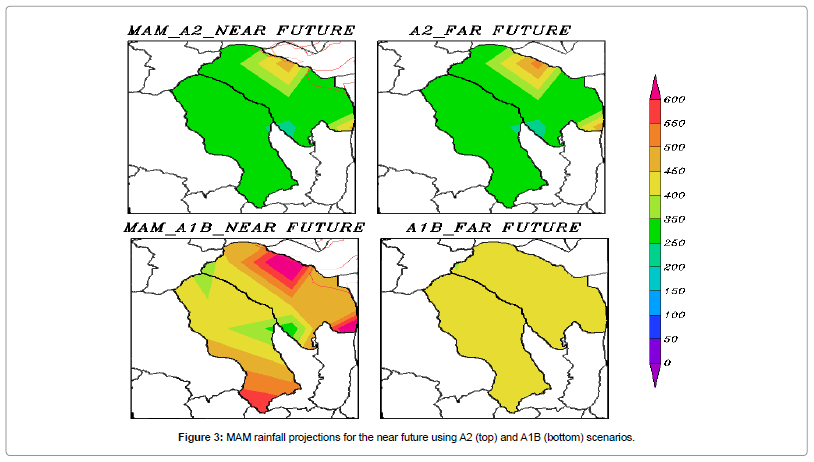
Figure 3: MAM rainfall projections for the near future using A2 (top) and A1B (bottom) scenarios.
A1B scenario projects a relatively higher seasonal rainfall in the study area for both climate periods where in the near future it projects a total MAM rainfall of 400-450 mm near lake Kyoga and southern sub counties in Nakaseke and the rest of the area is projected to have a MAM rainfall of between 350-400 mm. In the far future MAM rainfall is projected to be between 350-400 mm in the entire region.
The RCPs projections for RCP 4.5 and RCP 8.5 project a total MAM rainfall of between 400-450 mm at Nakasongola Station in both climate periods which is slightly less than A1B scenario projections but more than A2 scenario projections the at the same point.
SON: A2 scenario projects a total seasonal rainfall of between 350- 400 mm for most parts of the study area in the near future apart from the few places near lake Kyoga in the north eastern part of the study area where SON rainfall is projected to be near 500 mm. In the far future SON rainfall is projected to increase slightly with the lake shore getting between 500-550 mm and the rest of the study area getting a total SON rainfall of between 350-450 mm (Figure 4).
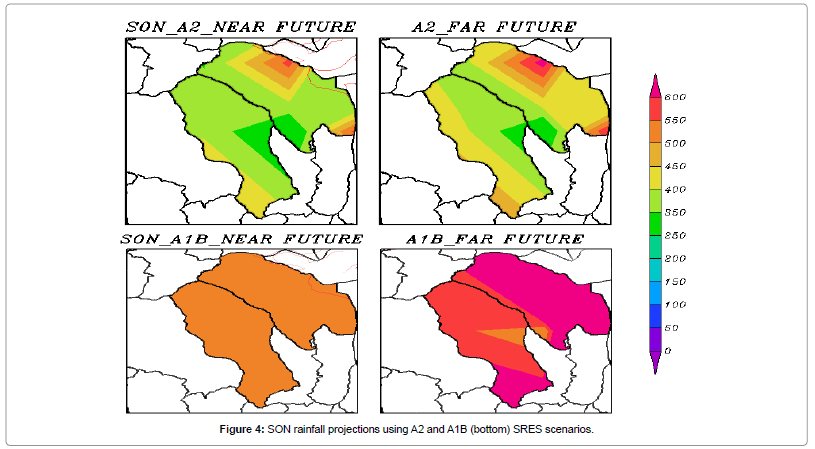
Figure 4: SON rainfall projections using A2 and A1B (bottom) SRES scenarios.
A1B scenario projects a relatively higher seasonal rainfall in the study area for both climate periods where in the near future it projects a total SON rainfall of 400-450 mm in the entire area of study. In the far future SON rainfall is projected to increase and may reach at a total of 500-600 mm in the entire study area.
RCP 4.5 and RCP 8.5 project a total SON rainfall of between 400- 450 mm in the near future at Nakasongola Station which is less than what both A1B and A2 scenarios project at the same point (Figure 5). In the far future RCP 4.5 and RCP 8.5 project a total SON rainfall of between 450-500 mm which compares well with SRES A2 but is less than A1B at the same point.
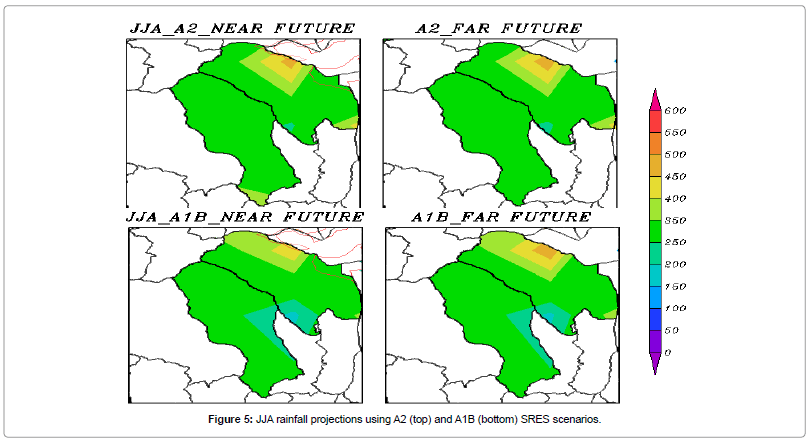
Figure 5: JJA rainfall projections using A2 (top) and A1B (bottom) SRES scenarios.
JJA and DJF: For the second dry season all SRES projections for A1B and A2 project a total JJA rainfall of between 150-200 mm in most parts of the study area apart from the lake shore area where rainfall is projected to be up to 250 mm (Figure 4). This pattern is observed for each of the SRES scenarios in both climate periods. The RCPs also project the similar JJA total rainfall at Nakasongola station in the same climate period (Figure 7).
A2 projects less than 50 mm of DJF rainfall in most parts of the study area with lake shore areas having up to 50 mm in both climate periods. However A1B shows that some significant increases in DJF rainfall where the area will get between 100-150 mm in the both climate periods with the lake shore regions having slightly more rainfall of 150- 200 mm in the far future (Figure 6). The RCPs project a total DJF rainfall of about 100 mm at Nakasongola station for both climate periods which is more than A2 projections but less than A1B projections at the same location (Figure 7).
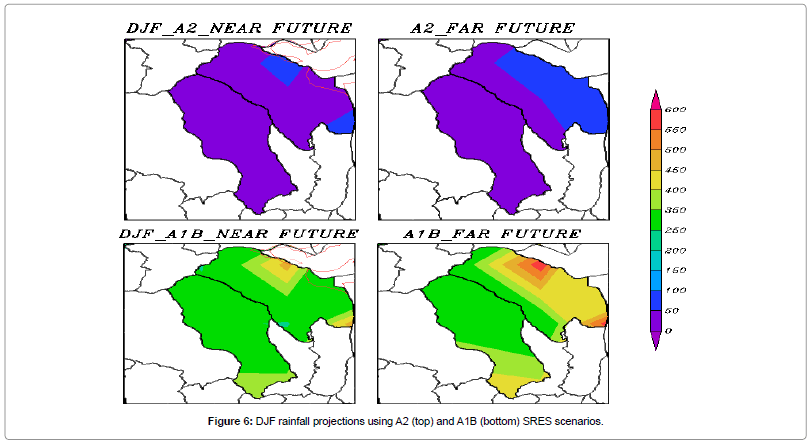
Figure 6: DJF rainfall projections using A2 (top) and A1B (bottom) SRES scenarios.
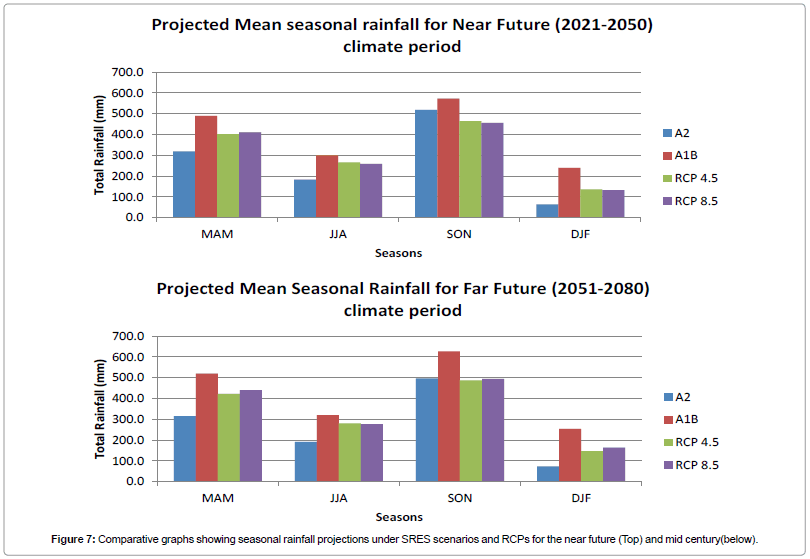
Figure 7: Comparative graphs showing seasonal rainfall projections under SRES scenarios and RCPs for the near future (Top) and mid century(below).
All the scenarios show a slight increase in precipitation from the near future period (2021-2050) to the far future period with the second rainfall season (SON) projected to have more rainfall than the known major rainfall season of March to May (MAM). Therefore the second rainfall season is projected to have more rainfall than the first season in all the scenarios (Figure 8).
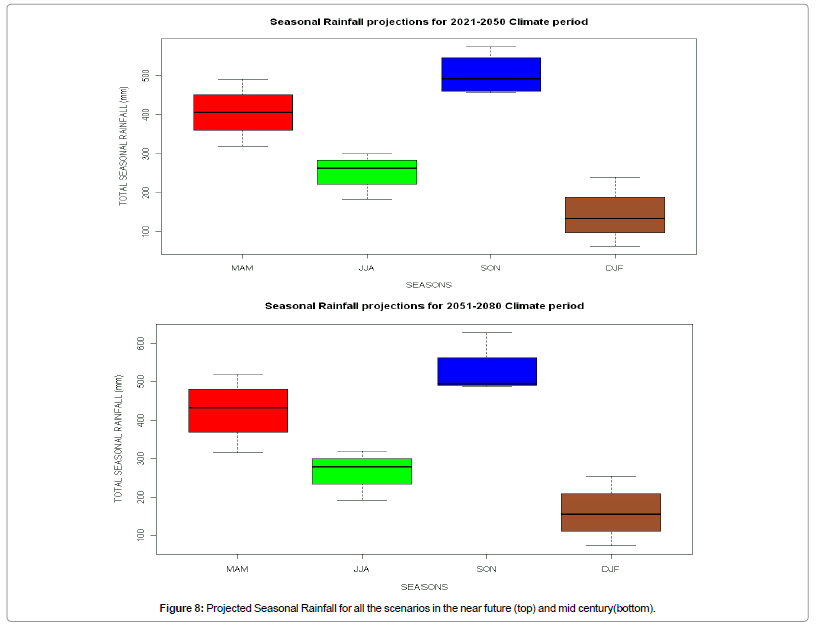
Figure 8: Projected Seasonal Rainfall for all the scenarios in the near future (top) and mid century(bottom).
Seasonal temperatures
MAM: A2 projected a temperature of 26-31°C for MAM in the study area for the near future climate period is between 3.1 -5.1°C more than the 1981-2010 climate average for Nakasongola station. In the far future MAM season is projected to have a temperature of between 31-33°C (Figure 9) which is between 4.9-6.4°C more than the 1981- 2010 climate average for Nakasongola station. A1B projected a slightly lower temperature of between 24-27°C in the study area for the near future which is 0.8-1.5 °C more than the 1981-2010 climate average for Nakasongola station. In the far future A1B projected a temperature of 26 -30°C (Figure 9) which is about 2.0-3.5°C morethan the 1981-2010 climate average for Nakasongola station.
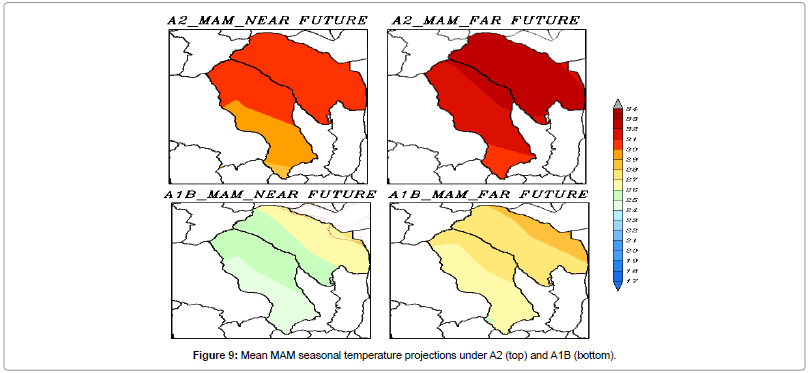
Figure 9: Mean MAM seasonal temperature projections under A2 (top) and A1B (bottom).
RCP 4.5 and RCP 8.5 project a mean seasonal temperature of 25.8°C and 26.1°C respectively in the near future at Nakasongola Station which is 1.0°C and 1.3°C more than the 1981-2010 mean MAM seasonal average. The two RCPs are comparable to A1B scenario but far less than the A2 scenario in the same period. For the far future period mean seasonal projections of 26.4°C and 27.4°C are expected for RCP 4.5 and RCP 8.5 respectively translating into temperature increases of 1.6°C and 2.6°C relative the 1981-2010 MAM seasonal average temperature. The RCPs projections are comparable to A1B of SRES but still lower than A2 scenario in the far future climate period.
JJA: A2 projected a temperature of 23-27°C for JJA in the study area for the near future climate period is between 1.3 -2.8°C more than the 1981-2010 climate average for Nakasongola station. In the far future JJA season is projected to have a temperature of between 27-30°C (Figure 10) which is between 3.6-4.8°C more than the 1981- 2010 climate average for Nakasongola station. A1B projected a slightly lower temperature of between 20-24°C in the study area for the near future which is 0.8-2.1°C more than the 1981-2010 climate average for Nakasongola station. In the far future A1B projected a temperature of 24 -27°C (Figure 10) which is about 2.2-4.2°C more than the 1981-2010 climate average for Nakasongola station.
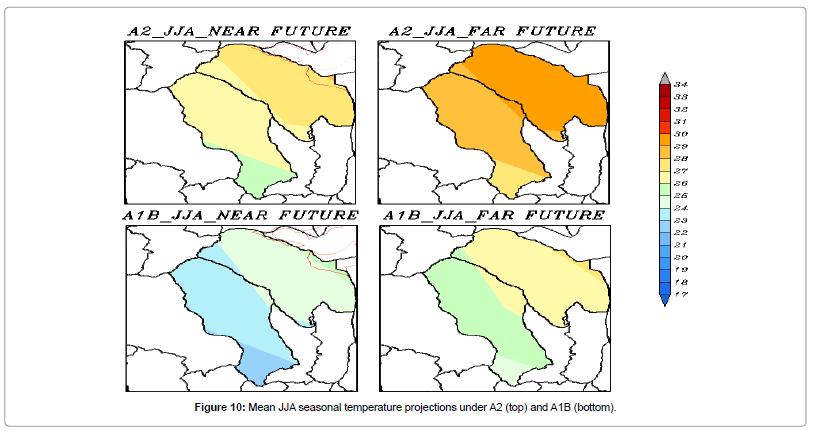
Figure 10: Mean JJA seasonal temperature projections under A2 (top) and A1B (bottom).
RCP 4.5 and RCP 8.5 project a mean seasonal temperature of 24.6°C and 24.9°C respectively in the near future at Nakasongola Station which is 1.2°C and 1.5°C more than the 1981-2010 mean JJA seasonal average. The two RCPs are comparable to A1B scenario but far less than the A2 scenario in the same period. For the far future period mean seasonal projections of 25.3°C and 26.4°C are expected for RCP 4.5 and RCP 8.5 respectively translating into temperature increase of 1.9°C and 3.0°C relative the 1981-2010 JJA seasonal average temperature (Figure 15). The RCPs projections are comparable to A1B of SRES but still lower than A2 scenario in the far future climate period.
SON: A2 projected a temperature of 26-29°C for SON in the study area for the near future climate period is between 2.2 -4.2 °C more than the 1981-2010 climate average for Nakasongola station. In the far future SON season is projected to have a temperature of between 27- 31°C (Figure 11) which is between 3.8-5.6°C more than the the 1981- 2010 climate average for Nakasongola station. A1B projected a slightly lower temperature of between 22-26°C in the study area for the near future which is 0.5-1.5°C more than the 1981-2010 climate average for Nakasongola station. In the far future A1B projected a temperature of 25-28°C (Figure 11) which is about 1.4-3.0 °C more than the 1981-2010 climate average for Nakasongola station.
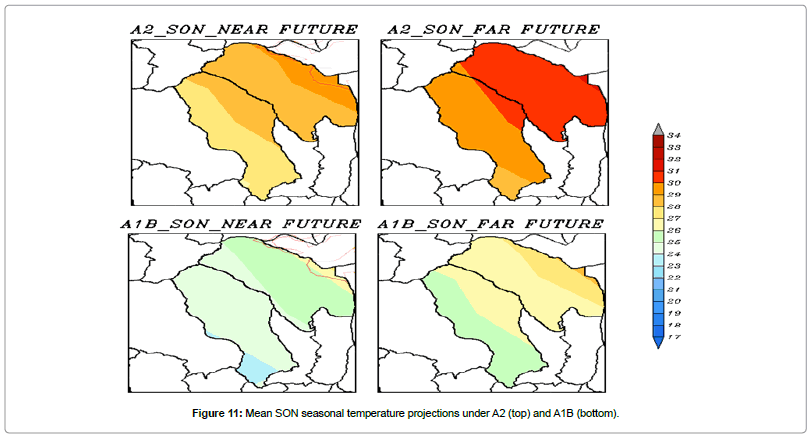
Figure 11: Mean SON seasonal temperature projections under A2 (top) and A1B (bottom).
RCP 4.5 and RCP 8.5 project a mean seasonal temperature of 24.9°C and 25.3°C respectively in the near future at Nakasongola Station which is 0.8°C and 1.2°C more than the 1981-2010 mean SON seasonal average. The two RCPs are comparable to A1B scenario but far less than the A2 scenario in the same period. For the far future period mean seasonal projections of 25.5°C and 26.6°C are expected for RCP 4.5 and RCP 8.5 respectively translating into temperature increase of 1.4°C and 2.5°C relative the 1981-2010 SON seasonal average temperature (Figure 15). The RCPs projections are comparable to A1B of SRES but still lower than A2 scenario in the far future climate period.
DJF: A2 projected a temperature of 30-32°C for DJF in the study area for the near future climate period is between 3.5 -5.3 °C more than the 1981-2010 climate average for Nakasongola station. In the far future DJF season is projected to have a temperature of between 32-34°C (Figure 12) which is between 5.8-6.6°C more than the 1981- 2010 climate average for Nakasongola station. A1B projected a slightly lower temperature of between 26-29°C in the study area for the near future which is 0.7-1.8°C more than the 1981-2010 climate average for Nakasongola station. In the far future A1B projected a temperature of 30-33°C (Figure 13) which is about 1.2-3.2 °C more than the 1981-2010 climate average for Nakasongola station.
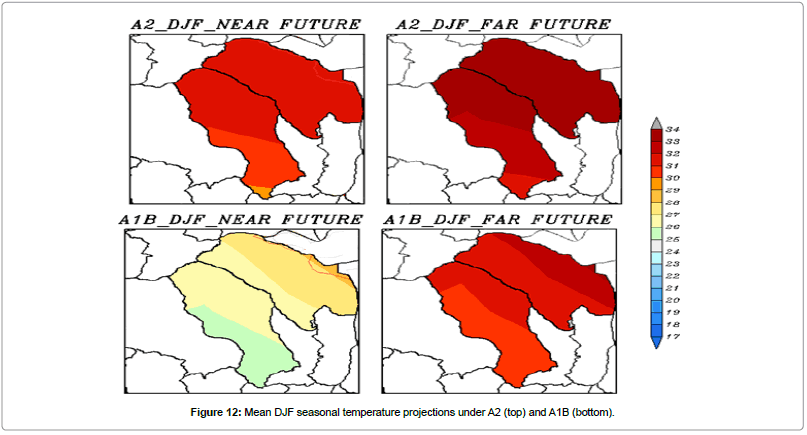
Figure 12: Mean DJF seasonal temperature projections under A2 (top) and A1B (bottom).
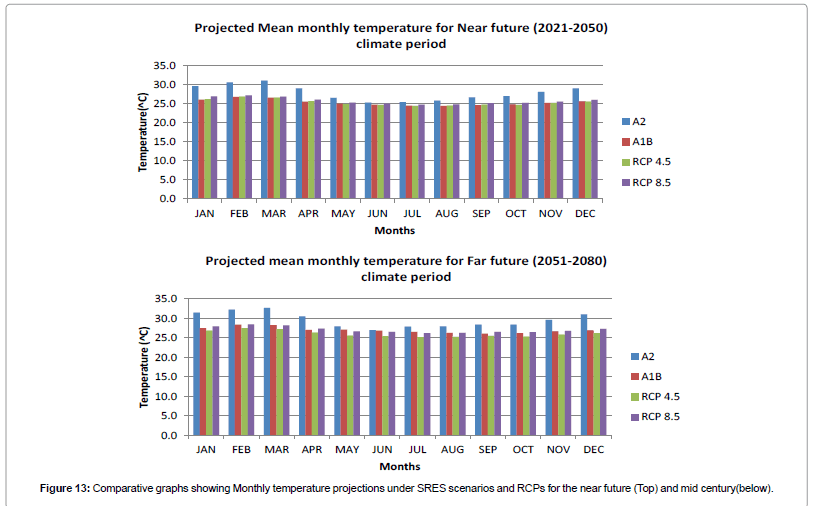
Figure 13: Comparative graphs showing Monthly temperature projections under SRES scenarios and RCPs for the near future (Top) and mid century(below).
RCP 4.5 and RCP 8.5 project a mean seasonal temperature of 26.3°C and 26.7°C respectively in the near future at Nakasongola Station which is 0.9°C and 1.3°C more than the 1981-2010 mean DJF seasonal average (Figure 14). The two RCPs are comparable to A1B scenario but far less than the A2 scenario in the same period. For the far future period mean seasonal projections of 26.9°C and 27.9°C are expected for RCP 4.5 and RCP 8.5 respectively translating into temperature increase of 1.5°C and 2.5°C relative the 1981-2010 DJF seasonal average temperature (Figure 15 &1 6). The RCPs projections are comparable to A1B of SRES but still lower than A2 scenario in the far future climate period.
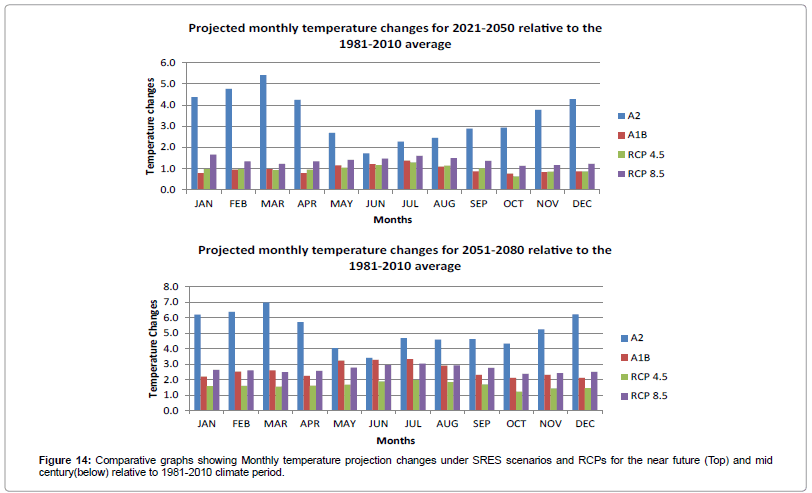
Figure 14: Comparative graphs showing Monthly temperature projection changes under SRES scenarios and RCPs for the near future (Top) and mid century(below) relative to 1981-2010 climate period.
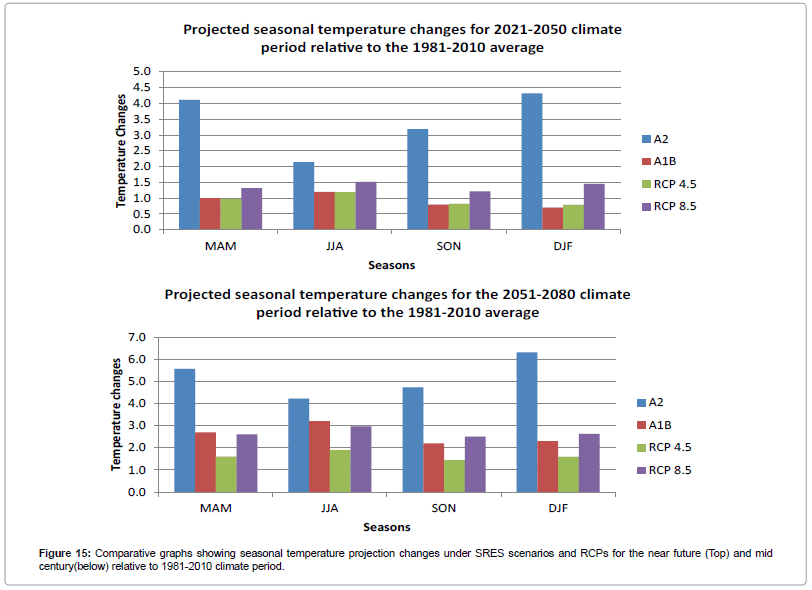
Figure 15: Comparative graphs showing seasonal temperature projection changes under SRES scenarios and RCPs for the near future (Top) and mid century(below) relative to 1981-2010 climate period.
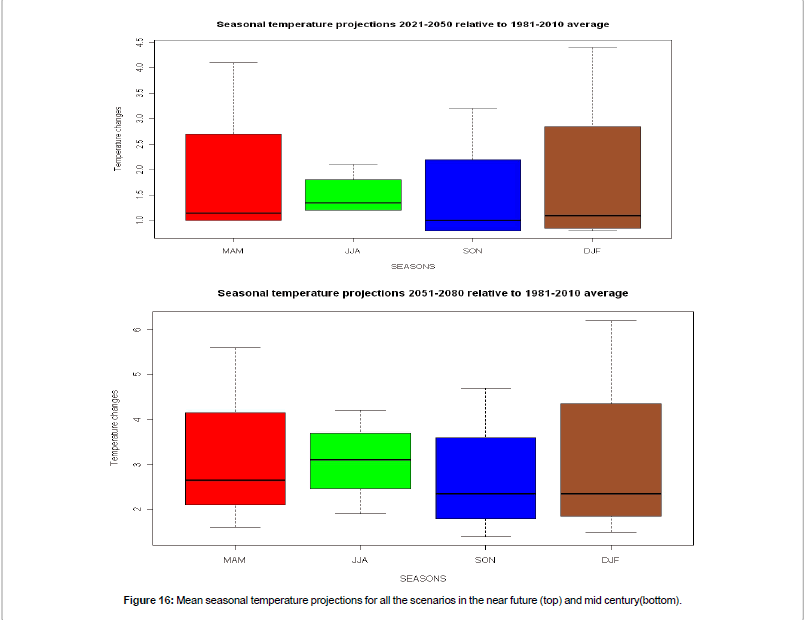
Figure 16: Mean seasonal temperature projections for all the scenarios in the near future (top) and mid century(bottom).
Discussion Of Results
Both A2 and A1B show temperature increases in average monthly, seasonal as well as annual for both near future and far future periods. A2 shows a mean annual temperature increase of 2.5 to 4.4°C in the near future and 4.5 to 6.0°C in the far future relative to the 1981-2010 average compared to A1B which shows annual temperature increase of 0.7-1.7°C in the near future and 1.7-3.5°C in the far future. The same trend is observed for RCP 4.5 and RCP 8.5 but the increments are lower for the RCPs compared to the SRES. The observed trend is consist with other studies in the region such as Hepworth and Goulden [17] who reported that average annual temperatures in Uganda would increase by 1.5°C by 2030 and by up to 4.3°C by the year 2080. Other studies such as USAID [18] have also projected average annual Ugandan temperatures to increase by 0.8-2°C by the year 2045 while McSweeney et al. [19] using GCMs projected average annual Ugandan temperatures to increase by 1.0-3.1°C by the year 2060 and by 1.4 -4.9°C by the year 2090 with the greatest warming observed in the June to August (JJA) season. The differences in the magnitude of temperature increases is due to the different baseline climates considered where in this study 1981-2010 was considered similar to USAID [18] compared to 1970- 1999 for McSweeney et al. [19], 1961-1990 for Hepworth and Goulden [17]. This temperature increase projected in the study area is likely to increase water stress that already exists in the study area due to increased evaporation and hence crop failure leading to low agriculture productivity [20].
The projected rainfall for both A1B and A2 show a slight increase in rainfall for the far future compared to the near future. A1B rainfall projections are slightly more than A2 projections in both climate periods. On average total annual rainfall in the study area is expected to remain the same as the current climate period with variations in seasonal rainfall expected. In all SRES (A2 and A1B) and RCPs (4.5 and 8.5), the second rainfall season of September to November (SON) is projected to have more rainfall compared to the known main season of March to May (MAM). This result means that the second rainfall season may be more reliable than the known major season of MAM. This result is related to USAID [18] who also reported significant increases in average DJF rainfall in the whole of Uganda for the period 2015-2045, however in general they reported no significant increase in annual rainfall for the entire country in the same period compared to 1981-2010 climate period [17,19,21].
Hulme et al. [21] also reported similar non-significant increases in Uganda annual rainfall 2020-2080 and 2050-2090 respectively.
Conclusion and Recommendations
In light of the above results and discussions it is clear that both SRES A2 and A1B project temperature increases in average monthly, seasonal as well as annual for both near future and far future periods with A2 showing a relatively high mean annual temperature increment range compared to A1B for the same periods. The same trend is observed for RCP 4.5 and RCP 8.5 but the increments are lower for the RCPs compared to the SRES. Projections for rainfall show a slight increase in annual rainfall in both SRES and RCPs. However more rainfall is projected for the second rainfall season of September to November compared to the usual known season of March to May (MAM). The projections also show a shift in rainfall with the usual dry season of December to February (DJF) now becoming wetter than the 1980-2010 average. Coping strategies should be designed to take advantage of the rainfall increment and reduce the effect of temperature increments.
References
- IPCC (2007) Summary for Policymakers. In: Climate Change 2007: Impacts, Adaptation and Vulnerability. Contribution of Working Group II to the Fourth Assessment Report of the Intergovernmental Panel on Climate Change. Parry ML, Canziani OF, Palutikof JP, van der Linden PJ, Hanson CE, (edn), Cambridge University Press, Cambridge, UK: 7-22.
- Butt TA, McCarl BA, Angerer JA, Dyke PA, Stuth JW (2005) The Economic and Food Security Implications of Climate Change in Mali. Clim Change 68: 355-378.
- Wang Y, Leung LR, McGregor JL, Lee DK, Wang WC, et al. (2004) Regional Climate Modeling: Progress, Challenges, and Prospects. J MeteorolSoc Japan 82: 1599-1628.
- Hewitson BC, Crane RG (1996) Climate downscaling; techniques and applications. Clim res 7: 85-95.
- Wilby RL, Wigley TML (2000) Precipitation predictors for downscaling: Observed and General Circulation Model relationships. Int J Climatol 20: 641–661.
- Jones RG, Hassell DC, Hudson D, Wilson SS, Jenkins GJ, et al. (2004) Generating high resolution climate change scenarios using PRECIS, Met Office Hadley Centre, Exter, UK 40.
- Nikicenovic N, Swart R (edn) (2000) IPCC special report on emissions scenarios. Cambridge University Press, Cambridge.
- Moss RH, Edmonds JA, Hibbard KA, Manning MR, Rose SK, et al. (2010) The next generation of scenarios for climate change research and assessment. Nature 463: 747-756.
- Riahi K, Grübler A, Nakicenovic N (2007) Scenarios of long-term socio-economic and environmental development under climate stabilization. Technol Forecasting Social Change 74: 887-935.
- Masui T, Matsumoto K, Hijioka Y, Kinoshita T, Nozawa T, et al. (2011) A Emission Pathway to Stabilize at 6W/m2 of Radiative Forcing. Clim Change 109: 33-57.
- Clarke L, Edmonds J, Jacoby H, Pitcher H, Reilly J, et al. (2007) Scenarios of Greenhouse Gas Emissions and Atmospheric Concentrations. Sub-report 2.1A of Synthesis and AssessmentProduct 2.1 by the U.S. Climate Change Science Program and the Subcommittee on Global ChangeResearch. Department of Energy, Office of Biological & Environmental Research, Washington DC 154.
- Van Vuuren DP, Stehfest E, Den Elzen MGJ, Deetman S, Hof A, et al. (2010c) RCP3PD: Exploring the possibilities to limit global mean temperature change to less than 2oC. Clim Change 109: 95-116.
- Lucinda M (2008) Impact of climate change on the terrestrial hydrology of a humid equatorial catchment in Uganda: PhD. Thesis, Department of Geography, University College, London.
- Sabiiti G (2008) Simulation of Climate Scenarios using the PRECIS Regional Climate Model over the Lake Victoria Basin: MSc. Dissertation, Department of Meteorology, University of Nairobi, Kenya.
- Metz B, Davidson OR, Bosch PR, Dave R, Meyer LA (2007) Contribution of Working Group III to the Fourth Assessment Report of the Intergovernmental Panel on Climate Change, 2007 Cambridge University Press, Cambridge, UK.
- Nimusiima A, Basalirwa CPK, Majaliwa JM, Otim-Nape W, Okello-Onen J, et al. (2013) Nature and dynamics of climate variability in the Uganda cattle corridor. Afr J Env Sci Tech 7: 770-782.
- Hepworth N, Goulden M (2008) Climate change in Uganda: understanding the implication and appraising the response. LTS International Ltd/ DFID Uganda.
- McSweeney C, New M, Lizanco G (2007) Climate Change Country Profiles: Uganda. United National Development Programme.
- Adejuwon JO (2006) Food crop production in Nigeria. II. Potential effects of climate change. Clim Res 32: 229-245.
- Hulme M, Doherty R, Ngara T, New M, Lister D (2001) African climate change: 1900-2100. Clim Res 17: 145-168.
Citation: Alex N, Basalirwa CPK, Majaliwa JGM, Mbogga SM, Mwavu EN, et al. (2014) Analysis of Future Climate Scenarios over Central Uganda Cattle Corridor. J Earth Sci Clim Change 5: 237. Doi: 10.4172/2157-7617.1000237
Copyright: © 2014 Alex N, et al. This is an open-access article distributed under the terms of the Creative Commons Attribution License, which permits unrestricted use, distribution, and reproduction in any medium, provided the original author and source are credited.
Share This Article
Open Access Journals
Article Tools
Article Usage
- Total views: 16184
- [From(publication date): 12-2014 - Apr 25, 2024]
- Breakdown by view type
- HTML page views: 11626
- PDF downloads: 4558