Brief Determination of Standard Formal Potentials for the Transfers of Several Pairing Anions across the Nitrobenzene/Water Interface by Na(I) Extraction with 18-Crown-6 Ether
Received: 29-Mar-2016 / Accepted Date: 23-Apr-2016 / Published Date: 30-Apr-2016 DOI: 10.4172/2155-9872.1000319
Abstract
Extraction constants (Kex±) for the extraction of sodium salts (NaA) with 18-crown-6 ether (18C6) from water (w) into nitrobenzene (NB) were determined at 298 K, together with the determination of individual distribution constants (KD,A) of several pairing anions A−. The symbols Kex± and KD,A were defined as [NaL+]NB[A−]NB/([Na+][L]NB[A−]) at L = 18C6 and [A−]NB/[A−], respectively; the subscript “NB” shows the NB phase. Also, ion-pair formation constants for sodium 2,4-dinitrophenolate (NaDnp) and its ion pair complex with 18C6 in water were determined by potentiometry with a Na+-selective electrode. Standardized (S) KD,A values were briefly calculated from the following thermodynamic cycle: KD,A S = Kex±/KD,Na SKNaL,NB. Here, KD,Na S and KNaL,NB denote the standardized individual distribution-constant of Na+ into and a complex formation constant for NaL+ in the NB phase, respectively. Moreover, equilibrium potential differences (Δφeq) at the NB/w interface were estimated from the relation Δφeq = 0.05916log (KD,A S/KD,A) at 298 K. The Δφeq values of A− = F3CCO2 −, MnO4 −, ReO4 − and Dnp− were determined for comparison with the value of picrate ion. The plot of log Kex± versus Δφeq gave a positive correlation at (correlation coefficient)2 = 0.748.
Keywords: Standard formal potentials; Individual distribution constants; Extraction into nitrobenzene; Ion-pair formation constants; Potentiometry; 18-Crown-6 ether
Introduction
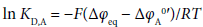
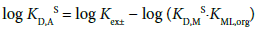
Individual distribution constants (KD,M and KD,A) of cations {Mz+ with the formal charge of z (= 1, 2)} and monovalent anions (A−) are generally important for the determination of equilibrium constants, such as complex formation (or stability) constants (KML,org) for MLz+ and acid dissociation ones of HA in organic (o or org) phases, in electrochemistry at water/o solution interfaces [1-5]. With respect to these distribution constants, the authors have proposed the presence of interfacial equilibrium potentials (Δφeq) in solvent extraction processes with such interfaces and determined so far many Δφeq values by applying this idea to the monovalent or divalent metal extraction with crown compounds (L) [6-10]. Here, the Δφeq values have been obtained from the relation [2,8], Δφeq = ΔφPic0′− 0.05916log KD,Pic at 298 K, based on the standardized formal potentials (ΔφPic0′) for the transfer of picrate ion (Pic−) across the nitrobenzene/water (NB/w) [7-9,11], benzene (Bz)/w [10], dichloromethane (DCM)/w [6,11] or 1,2-dichloroethane (DCE)/w interface [6,8]. On the other hand, there are systematic studies for many A− distribution from water into DCE or NB in the KD,A determination, using the CsA extraction with 24-crown-8 ether derivative [12] or the extraction of single salts [1,13], MA or MA2. However, the no relation between KD,A and Δφeq had been reported in these extraction studies [1,12,13]. Therefore, it is difficult to check whether the KD,A values experimentally-obtained are equivalent to those standardized at Δφeq = 0 V (namely the KD,AS {= exp(ΔφA0′/0.02569) at 298 K [2,8]} values) or not. According to our previous paper [14], KD,AS has been electrochemically derived at Δφeq =0 V from the equation
 (1)
(1)
being the same as that [2] described above. Here, the minus sign of the right hand side (rhs) of this equation comes from the formal charge of A− [11,14].
In order to clarify the presence of Δφeq for the transfers of other A− at the NB/w interface, as well as its presence for that of Pic−, we performed here extraction experiments of sodium salts, NaA, by 18-crown-6 ether (18C6) into NB at A− = MnO4−, ReO4−, F3CCO2− and 2,4-dinitrophenolate ion (Dnp−). For increasing the actual distribution efficiency of A(−I) and Na(I) as much as possible, 18C6 was used in the above extraction systems as the more effective L, compared with benzo- 18C6 and dibenzo-18C6 [15]. This idea had been actually employed by Levitskaia et al. [12]. Also, NB was used as a diluent for facilitating the dissociation of the ion-pair complex Na(18C6)+A− extracted in the o phase and then this caused totally an increase in extraction-ability of Na(I). Moreover, the ion-pair formation constants, KMAM0 and KMLA0, for NaDnp and Na(18C6)+Dnp− in water at I → 0 mol dm−3 were determined at 298 K by potentiometry [16] with a commercial Na+- selective electrode (Na+-SE). Here, the symbol I refers to ionic strength of the aqueous solution with Na+Dnp− or Na(18C6)+Dnp−.
Experimental
Materials and reagents
Purities of Na(I) in commercial F3CCO2Na (Aldrich, 98%) and NaReO4 (Aldrich, 99.99%) were checked by AAS measurements at 589.0 nm, while those of NaDnp⋅H2O (Tokyo Chemical Industries, >98.0%) and NaPic⋅H2O (Wako Pure Chemical Industries, >90%) absorption of 358 nm and the Pic− one of 355, respectively. Water contents of the former three Na(I) salts and commercial 18C6 (Wako Pure Chemical Industries, 98.0%) were determined by a Karl- Fischer titration: F3CCO2Na⋅0.0392H2O (0.517%); NaReO4⋅0.018H2O (0.12); NaDnp⋅0.505H2O (4.23); 18C6⋅0.0309H2O (0.210). Purity of NaMnO4⋅H2O (Aldrich, ≥ 97%) was determined by a redox titration with Na2C2O4 (Wako, 99.96%). The concentration of a basic aqueous solution with commercial HDnp (Tokyo Chemical Industries, >98.0%) was determined spectrophotometrically at 358 nm. Nitrobenzene (Kanto Chemical Co., min. 99.5%) was washed three-times with pure water and then was kept at a state saturated with pure water. Other reagents used here were of guaranteed reagent grades. Tap water was distilled once with a stainless steel-still and purified through the Autopure system (type WT 101 UV, Millipore).
Extraction experiments
Extraction experiments were essentially the same as those [17-19] reported before for the NaMnO4, NaO2CCF3 and NaReO4 extraction by 18C6 into DCE or NB. Amounts of Na(I) extracted into the NB phases were determined by the AAS measurements, where the same atomic absorption spectrophotometer (Hitachi, Japan) as that described previously [9] was used with the same accessories; Na(I) extracted into the NB phase was two-times back-extracted into an acidic aqueous solution. All the D values were less than unity, where D denotes a distribution ratio of Na(I) species extracted into the NB phase. A stock solution of 0.02 mol dm−3 NaMnO4 for the extraction experiments was diluted immediately before use and its diluted solution was used up within about 8 h [17].
Total concentrations, [NaA, HDnp or L]t, for the extraction experiments were [NaMnO4]t = 3.2 × 10⁻³ mol dm−3 with [L]t = 4.2 × 10⁻⁵-6.1 × 10⁻³ mol dm−3; [NaReO4]t = 9.0 × 10⁻³ with [L]t = 4.4 × 10⁻⁵- 4.4 × 10⁻³; [NaO2CCF3]t = 3.0 × 10⁻³ with [L]t = 4.4 × 10⁻⁴-3.6 × 10⁻²; [NaOH]t = 3.2 × 10⁻⁴-2.7 × 10⁻³, [HDnp]t or [NaDnp]t = (1.2-9.1) × 10−4 with [L]t = 1.4 × 10⁻⁴-2.9 × 10⁻²; see the x-axis in Figure 1 as a reference of [L]t. In particular, the total concentrations of mixtures of NaOH with HDnp or NaDnp were determined by the AAS measurements.

Figure 1: Plots of 2log D vs. log [18C6]NB for the NaA extraction by 18C6 into NB at A−=MnO4− (triangle), Dnp− (circle), ReO4− (diamond) and F3CCO2− (square). See the text for the regression lines.
Data analysis
An extraction model for the data analysis was shown in Appendix A, supplementary information. In the [A−] calculation, the KHA values were neglected by assuming that HA is strong acids in water for A−= MnO4−, ReO4− and F3CCO2−. Similarly, KD,HA or Kex, HA (= KHA⋅KD,HA) value was neglected. Therefore, the following equation was used: [A−] ≈ ([A]t − Ab)/(1 + {KNaA + (KNaLK1/KD,L)[L]NB}[Na+]) (see Appendix A) instead of the more-exact equation [A−] = ([A]t − Ab)/(1 + {KNaA + (KNaLK1/KD,L)[L]NB}[Na+] + (KHA + Kex,HA)[H+]). Here, K HA</−1, KD,HA and Kex,HA denote the acid dissociation constant of HA in water, the distribution one of HA into and an extraction one (mol−1 dm3) for HA into the NB phase, respectively, and see Appendix A for the other equilibrium constants and the symbol Ab.
Similarly, the experiments for the NaDnp extraction system were almost performed in the pH range of more than 10. This pH value means the condition of [HDnp]/[Dnp−] ≤ 10−6 (≈ [H+]KHDnp = 10−10.8⋅104.1 [20]). Hence, the KHA, KD,HA and Kex,HA values were neglected in the calculation.
Emf measurements
The following cell was used for the determination of the KMA0 and KMLA0 values: Ag|AgCl|3.3 mol dm−3 KCl|0.1 mol dm−3 (C2H5)4NCl|test solution|Na+-SE. Here, the test solutions were aqueous solutions of NaCl for preparing calibration curves and those of NaDnp and its solutions with 18C6 for the KMA0 - and KMLA0-determination, respectively. Experimental slopes of the calibration curves were in the ranges of 59-74 mV/decade for the NaDnp system, 57-62 for NaPic, 69-76 for NaDnp-18C6 and 65-76 for NaPic-18C6.
The emf values of the above cell were measured at 25 ± 0.3°C using a Horiba pH/ion meter (type F-23) equipped with a Horiba Na+-SE (type 1512A). Liquid junction potentials (ΔELJ) at the 0.1 mol dm-3 (C2H5)4NCl|test solution interface in the cell were not corrected. An effect of this treatment was examined by determining the the KMA0 and KMLA0 values at MA = NaPic and MLA = Na(18C6)Pic, respectively (see below).
Results and Discussion
Potentiometric determination of ion-pair formation constants for NaDnp and Na(18C6)Dnp in water
The following equations were used for the determination of the KMA0 and KMLA0 values [16].
 (2)
(2)
 (3)
(3)
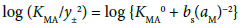
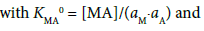
with KMLA0 = [MLA]/(aML⋅aA). Here, y± and aj denote a mean activity coefficient and an activity (mol dm−3) of species j (= M+, A−, ML+) in water, respectively. Also, we assumed that the activity coefficients of MA and MLA are unity. Figures 2a and 2b show a plot of log (KMA/y± 2) versus (aM)2 for MA = NaDnp and that of log (KMLA/y± 2) versus aML⋅aA for MLA = Na(18C6)Dnp, respectively. Regression analyses of these plots at 298 K yielded KNaDnp0 = 8.1 ± 1.2 mol−1 dm3 with bs = (1.7 ± 0.2) × 10−3 mol dm−3 at (correlation coefficient)2 (R2) = 0.741 and KNa18C6Dnp0 = 78 ± 18 with b = (1.5 ± 0.5) × 10−3 at R2 = 0.801. The symbols bs and b refer to empirical parameters for curve fittings [16]. Solid lines shown in Figures 2a and 2b were the regression ones based on the curve fittings of the plots into Equations (2) and (3).

Figure 2a: Plot of log (KMA/y±2) vs. (aM)2 for the NaDnp (= MA) system.

Figure 2b: Plot of log (KMLA/y±2) vs. aML⋅aA for the Na (18C6) Dnp (= MLA) system.
In order to check the accuracy of these values, the KNaPic0 and KNa18C6Pic0 values were determined potentiometrically: KNaPic0 = 7.7 ± 0.5 mol−1 dm3 with bs = (5.1 ± 0.5) × 10−4 mol dm−3 at R2 = 0.941 and KNa18C6Pic0 = 136 ± 15 with b = (6.8 ± 0.5) × 10−4 at R2 = 0.960. The former value is close to that (= 4.2 mol−1 dm3 [16]) reported before. On the other hand, the latter value is two-times larger than the literature one (= 62 [16]). These facts indicate that the KNaDnp0 value which was thus determined is essentially reliable, while the KNa18C6Dnp0 value is an approximate (see below for the analyses of extraction data). Additionally, it can be important that we obtained to a certain degree the reliable KMA0 and KMLA0 values without troublesome corrections of the ΔELJ values in the emf measurements. Hence, the two values were used for the calculation [17-19] of the [Na+], [18C6]NB, and [Dnp−] values in the analyses on the extraction experiments (see Appendix A). Moreover, we think that this simple procedure has a possibility for the KMA0 - and KMLA0 - determination, namely can become the procedure without the troublesome ΔELJ corrections.
Determination of composition of the extracted species
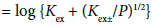
Procedures for determining the composition of Na(I):L:A(−I) at L = 18C6 were the same as those [11,17-19] reported before. That is, plots of log (D/[A−]) (call this procedure plot I) and 2log D (call it plot II) versus log [L]NB are useful for the composition determination of both the ion-pair (NaL+A−) extraction and the NaL+ extraction with the pairing (or counter) anion A− into the NB phase, respectively. Also, the intercepts of the plots I and II correspond to the approximate values of log Kex and log Kex±, respectively [6,8,11,17-19]: Kex is defined as [MLA]o/P and Kex± as [ML+]o[A−]o/P with P = [M+][L]o[A−]. Figure 1 shows their plots for the NaA extraction by 18C6 into NB. Basic data for the systems employed were a slope of 1.07 and an intercept of 1.76 at R2 = 0.990 in the plot II for the MnO4− system, 0.96 and −0.37 at R2 = 0.942 in that for ReO4−, 0.96 and −1.38 at R2 = 0.755 in that for F3CCO2− and 0.97 and 0.17 at R2 = 0.832 in that for Dnp−. The above slopes being in the range of 0.9 to 1.1 [11] indicate the extraction of species with Na(I):18C6:A(−I) = 1:1:1 into the NB phase at least. In this study, all the slopes of the plots I were less than 0.9, indicating the detectable dissociation of NaL+A− in the NB phase [17].
Determination of the KD,A, Kex± and Kex values
The KD,A, Kex± and Kex values were determined by the same methods as those [6,8,10,11,17] reported before, together with the K1,org (= Kex/ Kex±) value. That is, the following extraction constants parameters (Kexmix) [6,8,10,11,17] were fundamentally used for the determination:
 (4)
(4)
 (4a)
(4a)
with  under the condition of [MLA]o + [ML+]o >> [M+]o + … in the o phase. Non-linear regression analyses based on Equations (4) and (4a) yield the KD,A and Kex± values, together with the Kex one, respectively [6,8,10,11,17]. Figures 3 and 4 show the plots based on Equations (4) and (4a), respectively; the figures were examples of the F3CCO2 and Dnp− systems. The R2 values of the regression lines obtained from Equations (4) and (4a) were 0.910 and 0.773 for A− = MnO4−, 0.884 and 0.689 for ReO4, 0.721 and 0.701 for F3CCO2−and 0.884 and 0.933 for Dnp−, respectively.

Figure 3: Plot of log Kex mix vs. −log ([Na+][18C6]NB) for the NaA-18C6 system at A−=F3CCO2− (square) and Dnp− (circle). See the KD,A and Kex values in Table 1 about the data of the regression lines.

Figure 4: Plot of log Kex mix vs. − (1/2)log P for the NaA-18C6 system at A−=F3CCO2− (square) and Dnp− (circle). See the Kex± and Kex values in Table 1 about the data of the regression lines.
The K1,org value is easily calculated from the above relation [6,8,10,11,17]. Also, the KD,NaL (= [NaL+]NB/[NaL+]) values at L = 18C6 were estimated from the relation, INBKD,L/(KNaL[Na+][L]NB), in each run. Here, KD,NaL, KD,L and KNaL denote the individual distribution constant of NaL+, that (= [L]NB/[L]) of L into the NB phase and the complex formation constant (= [NaL+]/[Na+][L]) for NaL+ in water, respectively (see Appendix A): these latter two values were available in references. Table 1 lists the above equilibrium constants determined at 298 K.
| A- | log Kk | ||||
|---|---|---|---|---|---|
| Kk = Kex±a | Kexb | KD,Ab (I )c | K1,NBd (INB)e | KD.NaLf | |
| MnO4- | 0.84±0.12 | 5.12±0.03 | -1.95±0.05 (0.0028) |
4.29±0.13 (3.4´10-5) |
0.85±0.11 |
| ReO4- | -0.97±0.14 | 3.79±0.03 | -2.68±0.07 (0.0081) |
4.75±0.14 (1.8´10-5) |
-0.05±0.13 |
| F3CCO2- | -1.28±0.22 | 3.34±0.06 2.61±0.70a |
-2.76±0.12 (0.0026) |
3.89±0.73 (4.8´10-6) |
-0.90±0.29 |
| Dnp- | 0.61±0.06 | 4.55±0.32 | -1.34±0.09 (0.0012) |
3.94±0.32 (2.9´10-5) |
0.45±0.41 |
| Pic-g | 1.51, 2.6h | 7.19, 7.02 | -2.50 (0.00033) |
5.7 (1.0´10-6) |
1.1 |
aValues determined by Equation (4a) with the fixed Kex values, except for the F3CCO2 − system. bValues determined by Equation (4). cIonic strength at the w phase. dValues calculated from Kex/Kex±. eI value at the NB phase. fValues calculated from INBKD,L/(KML[M+][L]NB). g[11]. hEstimated value [23].
Table 1: Fundamental data for the NaA extraction with L = 18C6 into NB at 298 K.
The log Kex and log Kex± values were in the orders A− = F3CCO2− < ReO4− < Dnp− < MnO4− < Pic−. The log KD,NaL values were in the same order as those for log Kex and log Kex±. Also, the log KD,A values were in the order F3CCO2− ≤ ReO4− < Pic− < MnO4− < Dnp−.
The order of the log K1,NB values was F3CCO2− ≤ Dnp− ≤ MnO4− < ReO4− < Pic. Ionic radii [21] of A− are assumed to be H3CCO2 (2.32 Å) ≤ F3CCO2− < MnO4− (2.40) < ReO4− (2.60) < Dnp− < Pic−. On the other hand, the ion size parameters [16,22] in aqueous solutions were in the order MnO4− (3.5) < ReO4− (3.9) < H3CCO2 − and H2ClCCO2 − (4.5 Å) ≤ F3CCO2− < Dnp− < Pic− (7). Here, the positions for F3CCO2−, Dnp− and Pic− in the both orders were predicted empirically. Hence, the log K1,NB order suggests there are two groups: MnO4− and ReO4−; F3CCO2−, Dnp− and Pic−. Unfortunately, we cannot now explain a reason about the K1,NB order.
Happily, the difference in a set of KNaPic0 and KNa18C6Pic0 (mol−1 dm3) between 4.2 and 62 [16] and 7.7 and 136 did not affect the main results of the data analyses in the NaPic extraction by 18C6 into NB, as follows. The Kex, KD,Pic or K1,NB value well agreed with each other and the Kex± one calculated from 7.7 and 136 mol−1 dm3 was in agreement with its corresponding value in Table 1 within the experimental error of ± 0.5. Their logarithmic values were 7.19 ± 0.07 at Kex, −2.50 ± 0.39 at KD,Pic, 1.47 ± 0.53 at Kex± and 5.72 ± 0.53 at K1,NB. These results suggest that the extraction data for the NaDnp system with 18C6 are also reliable.
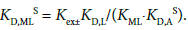
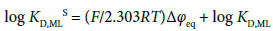
Estimate methods of the KD,A S, Δφeq and KD,MLS values at the NB/w interfaces
When the KD,MS value, KD,M at Δφeq = 0 V, is available from some references and the Kex± value was obtained from the present extraction experiment, the KD,AS value can be easily calculated from the following thermodynamic relation:
 (5)
(5)
Similarly, KML,org is introduced as the reference value in this equation: log  = 7.7 [23] at L = 18C6 and 298 K; log KD,NaS (= −ΔφNa0′/0.05916 = −16.90ΔφNa 0′) = −5.18 [13] (see Appendix A).
Also, the thus-obtained KD,AS value is introduced in
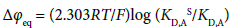 (1a)
(1a)
with
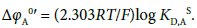 (1b)
(1b)
So we can immediately obtain the Δφeq and ΔφA0′ values from Equations (1a) and (1b), respectively. Of course, the KD,A values can be determined experimentally (Table 1).
Furthermore, the KD,MLS values averaged were calculated from two procedures as follows. (A): procedure estimated from a thermodynamic cycle. Its cycle is
 (6)
(6)
Except for the KD,L and KML values, the other values were determined here. For the two values, we adopted log KNaL = 0.73 [15] and log KD,L = −1.00 [24] at L = 18C6 (see Appendix A) and accordingly log (KD,L/ KNaL) becomes −1.73.
(B): procedure estimated from the Δφeq and KD,ML values. Its equation is
 (6a)
(6a)
which is derived from Δφeq = ΔφML0′ + (2.303RT/F)log KD,ML with log KD,MLS = −(F/2.303RT)ΔφML0′ at z = 1. The experimental KD,ML values were individually calculated from the relation KD,ML ≈ [A−]NB/[ML+] (= INBKD,L/KML[M+][L]NB) under the approximate condition (see the footnote f in Table 1) of [A−]NB ≈ [ML+]NB, which comes from the charge balance equation [A−]NB = [M+]NB + [ML+]NB {see Equation (B1) in Appendix B, supplementary information}, and then their values were averaged. Here, the fact that the Δφeq value is in common for a given extraction system was over-interpreted in the mean calculation {see Equation (1a)}. The above procedures, (A) and (B), are described as fundamental ones in the calculations, although other procedures were able to be considered practically and were tried. The KD,AS, Δφeq and KD,NaLS values obtained from the above are listed in Table 2, together with the ΔφA0′ values.
| A- | log KD,AS a (ΔfA0¢ b/V) | Δφeqc/V | log KD,NaLSd |
|---|---|---|---|
| MnO4- | -1.68, -1.16e (-0.10, -0.069) | 0.016, 0.047f | 0.72, 0.58g, 0.059f,g |
| ReO4- | -3.49(-0.21) | -0.048 | 0.72, 0.76g |
| F3CCO2- | -3.80(-0.22) | -0.062 | 0.72, 0.14g |
| Dnp- | -1.91, -2.0e(-0.11, -0.12) | -0.034, -0.036f | 0.79, 1.02g, 1.12f,g |
| Pic-h | 0.05e(0.0030) | 0.15, 0.11i | -0.27, -1.43g, -0.75i,j |
| Without A- | ---k | ---k | 0.7l |
aValues calculated from Equation (5) at M = Na. bValues reduced from the logKD,AS values with Equation (1b). cValues calculated from Equation (1a). dValues calculated from the procedure (A). e[13]. fValue calculated from Equation (1a) with the value of the footnote e. gValues calculated from the procedure (B). h[11]. iValue calculated from the charge balance equation for the NB phase without any approximations [8] and Appendix B. jValue calculated from the procedure (B) with the value of the footnote i. kNot have the corresponding values. lValue obtained at 298 K and INB = 0.05 mol dm−3 (Bu4N+BPh4−) from ion-transfer polarographic measurements [25].
Table 2: Log KD,AS, ΔφA0′, Δφeq and log KD,Na S values for the NaA extraction with L = 18C6 into NB at 298 K.
The log KD,AS order was F3CCO2− < ReO4− < Dnp− < MnO4− < Pic−; this means that the ΔφA 0′values were in the same order. This order was reflected to the log Kex and log Kex± orders. The KD,AS values for A− = MnO4− and Dnp− were close to those [13,23] reported before. Also, the log KD,NaLS order was Pic− < F3CCO2− ≈ MnO4− ≈ ReO4− ≤ Dnp−. Especially, the latter four values (0.7-0.8 = log KD,NaLS) were in agreement with that (0.7 [25]) at the NB/w interface directly-determined by iontransfer- polarographic measurements. These facts suggest that 0.7 is appropriate to the log KD,NaLS value.
Correlation between log Kex± and Δφeq
A plot of log Kex± versus Δφeq gave a positive correlation: log Kex± = (13.2 ± 2.9)Δφeq + (0.38 ± 0.27) at R2 = 0.748 (Figure 5); the point of MnO4− due to ref. [13] was removed from the regression calculation because of uncertainty of the Δφeq value. This plot can come from Equation (5). For example, by adding the Δφeq term in the both sides of Equation (5), Equation (5) can be modified as

Figure 5: Plot of log Kex± vs. Δφeq for the NaA extraction by 18C6 into NB. The regression line was log Kex± =(13.2 ± 2.9) Δφeq+(0.38 ± 0.27) at R2=0.748, except for the triangle point of MnO4−. See Tables 1 and 2 for the plot data.
 (5a)
(5a)
with log KD,A = −16.90Δφeq + log KD,AS {see Equation (1a) and Appendix B} at 298 K and the rhs of Equation (5a) becomes 16.90Δφeq + log KD,A + 2.52. Also, the log KD,A values for the five extraction systems were in the range of −2.8 to −1.3. Therefore, the value of log KD,A + 2.52 can be estimated at −0.3 to 1.2. This range which corresponds to the intercept of the plot includes the experimental intercept (= 0.4). This fact indicates that the plot is essentially based on Equation (5a), namely Equation (5).
Moreover, the log KD,A values can cause the larger deviation of the plots from the regression line (Figure 5), because their values are not constant among A− employed. This is proved by the plot of log (Kex±/KD,A) versus Δφeq. The regression analysis of this plot yielded the equation, log (Kex±/KD,A) {= log ([NaL+]NB/[Na+][L]NB)} = 15.3Δφeq + 2.4 at R2 = 0.896. This improvement on R2 clearly shows a variance effect of log KD,A.
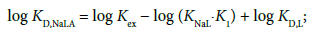
Similar correlations have been observed in the plots of log Kex± versus Δφeq for the NaPic extraction with the four L into the two diluents [10,11]. These plots are based on the other modified form of Equation (5a): log Kex± = 16.90(-Δφeq) + log KD,Na+ log (KD,PicS⋅KNaL,org) [11] at org = DCM and DCE. For the Bz extraction system, a similar plot has been obtained, but its slope (= 84 V−1 [10]) was much larger than the theoretical value, 16.90 (= F/2.303RT) at 298 K. These facts also support that Equation (5a) is effective for an explanation of the above correlation.
Correlation between log KD,NaLA and log KD,AS
The log KD,NaLA {= log ([NaLA]NB/[NaLA])} value was calculated from the thermodynamic relation [15,17].
 (7)
(7)
since NaLA is a neutral ion pair, its distribution constant naturally satisfies the condition of Δφeq = 0 V [26]. Here, the symbol K1 is defined as [NaLA]/[NaL+][A−] (see Appendix A) and its values slightly changed with changes of I. The log KD,NaLA values obtained were 1.01 for A− = MnO4-, −0.44 for ReO4-, −0.97 for F3CCO2− and 0.96 for Dnp−; its value for Pic− was reported to be 3.68 [11]. Figure 6 shows a plot of log KD,NaLA versus log KD,AS for the present extraction systems with A−. There was a good linear correlation between them at R2 = 0.974. This result indicates that a distribution property of Na(18C6)A into the NB phase reflects that of A−. In other words, it means that the following relation holds in the present extraction systems: log KD,NaLA = log KD,AS + log (KNaL,NB/KNaL) + log (KD,NaS⋅KD,18C6) + log (K1,NB/K1) ≈ log KD,AS + 0.72 + log (K1,NB/K1), although the coefficient of log KD,AS was somewht larger than unity. Here, this relation is derived from log Kex = log Kex± + log K1,NB {see Equations (6) and (7)}. The average values of K1/mol−1 dm3 were 101.77 for A− = Pic−, 102.31 for MnO4−, 102.43 for ReO4−, 101.86 for Dnp−and 102.51 for F3CCO2−. Therefore, an estimate of the intercept, 0.72 + log(K1,NB/K1), becomes in the range of 2.1 to 4.7. Its experimental value was 3.32 ± 0.23 (see the caption in Figure 6), overlapping this estimate. On the other hand, a plot of log KD,NaLA versus log KD,A at Δφeq ≠ 0 V did not yield the correlation (R2 = 0.038).

Figure 6: Plot of log KD,NaLA vs. log KD,AS at L=18C6 and A−=MnO4− (2 data), ReO4−, F3CCO2−, Dnp− (2 data) and Pic−. The regression line was log KD,NaLA=(1.15 ± 0.09)log KD,AS+(3.32 ± 0.23) at R2=0.974, except for the triangle point of MnO4−.
Conclusion
The authors clarified the presence of Δφeq at the NB/w interfaces in the NaA extraction systems with 18C6, as well as the NaPic extraction one. Also, the positive correlation of log Kex± to Δφeq among A− was observed in a given combination of Na+, NB, and 18C6. This fact makes the previously-reported correlation among L in given combinations of NaPic and diluents more-sure. Moreover, it was demonstrated that this method makes the ΔφA0′- or KD,AS-determination of a single A− having the lower extraction-ability easier. In particular, using the more general L, such as 18C6, is important for the present method, because this promises the high versatility of the method.
References
- Rais J (1971) Individual Extraction Constants of Univalent Ions in the System Water-Nitrobenzene. Collect Czech Chem Commun 36: 3253-3262.
- Sanchez Vallejo LJ, Ovejero JM, Fernández RA, Dassie SA (2012) Single Ion Transfer at Liquid/Liquid Interface. Int J Electrochem 462197.
- Ohkouchi T, Kakutani T, Sanda M (1991) Electrochemical Study of the Transfer of Uncouplers across the Organic/Aqueous Interface. Bioelectrochem Bioenerg 25: 71-80.
- Lagger G, Tomaszewski L, Osborne MD, Seddon BJ, Girault HH (1998) Electrochemical Extraction of Heavy Metal Ions Assisted by Cyclic Thioether Ligands. J Electroanal Chem 451: 29-37.
- Kudo Y, Imamizo H, Kanamori K, Katsuta S, Takeda Y, et al. (2001) On the Facilitating Effect of Neutral Macrocyclic Ligands on the Ion Transfer across the interface between Aqueous and Organic Solutions Part III Competitive Facilitated Ion-Transfer. J Electroanal Chem 509: 128-138.
- Kudo Y, Ogihara M, Katsuta S, Takeda Y (2014) An Electrochemical Understanding of Extraction of Silver Picrate by Benzo-3m-Crown-m Ethers (m = 5, 6) into 1,2-Dichloroethene and Dichloromethane. Amer J Anal Chem 5: 433-444.
- Kudo Y, Takeuchi T (2014) On the Interfacial Potential Differences for the Extraction of Alkaline-Earth Metal Picrates by 18-Crown-6 Ether Derivatives into Nitrobenzene. J Thermodyn Catal 5: 133.
- Kudo Y, Katsuta S (2015) On an Expression of Extraction Constants without the Interfacial Equilibrium-Potential Differences for the Extraction of Univalent and Divalent Metal Picrates by Crown Ethers into 1,2-Dichloroethane and Nitrobenzene. Amer J Anal Chem 6: 350-363.
- Kudo Y, Katsuta S, Ohsawa Y, Nozaki K (2015) Solvent Extraction of Cadmium Picrate by 18-Crown-6 Ether into Several Less-polar Diluents and Nitrobenzene: Re-evaluation of the Corresponding Overall Extraction Systems. J Thermodyn Catal 6: 146.
- Kudo Y, Nakamori T, Numako C (2016) Extraction of Sodium Picrate by 3m-Crown-m Ethers and Their Mono-benzo Derivatives (m = 5, 6) into Benzene: Estimation of Their Equilibrium Potential Differences at the Low-polar Diluent/Water Interface by an Extraction Method. Journal of Chemistry.
- Kudo Y, Amano T, Ikeda S (2016) Extraction of Sodium Picrate by Several Crown Ethers into Dichloromethane, 1,2-Dichloroethane, and Nitrobenzene: Estimation of Their Interfacial Equilibrium-potential Differences by an Extraction Method. Chemistry Journal.
- Levitskaia TG, Maya L, Van Berkel GJ, Moyer BA (2007) Anion Partitioning and ion-Pairing Behavior of Anions in the Extraction of Cesium Salts by 4,5-Bis(tert-octylbenzo)dibenzo-24-crown-8 in 1,2-Dichloroethane. Inorganic Chemistry 46: 261-272.
- Kudo Y, Harashima K, Hiyoshi K, Takagi J, Katsuta S, et al. (2011) Extraction of Some Univalent Salts into 1,2-Dichloroethane and Nitrobenzene: Analysis of Overall Extraction Equilibrium Based on Elucidating Ion-pair Formation and Evaluation of Standard Potentials for Ion Transfers at the Interface between Their Diluents and Water. Anal Sci 27: 913-919.
- Kudo Y, Horiuchi N, Katsuta S, Takeda Y (2013) Extraction of Cadmium Bromide and Picrate by 18-Crown-6 Ether into Various Less-polar Diluents: Analysis of Overall Extraction Equilibria Based on Their Component Equilibria with Formation of Their Ion Pair in Water. J Mol Liq 177: 257-266.
- Takeda Y (2002) Extraction of Alkali Metal Picrates with 18-Crown-6, Benzo-18-crown-6, and Dibenzo-18-crown-6 into Various Organic Solvents. Elucidation of Fundamental Equilibria Governing the Extraction-ability and -selectivity. Bunseki Kagaku (Analytical Chemistry) 51: 515-525 (in Japanese).
- Kudo Y (2013) Potentiometric Determination of Ion-Pair Formation Constants of Crown Ether-Complex Ions with Some Pairing Anions in Water Using Commercial Ion-Selective Electrodes. InTech-Open Access Publisher, Croatia.
- Kudo Y, Harashima K, Katsuta S, Takeda Y (2011) Solvent Extraction of Sodium Permanganate by Mono-benzo 3m-Crown-m Ethers (m = 5, 6) into 1,2-Dichloroethane and Nitrobenzene: a Method which Analyses the Extraction System with the Polar Diluents. Int J Chem 3: 99-107.
- Kudo Y, Fujihara R, Ohtake T, Katsuta S, Takeda Y (2008) Evaluation of the Hydrophilic Properties of Sodium Ion-pair Complexes with 3m-Crown-m Ethers (m = 5, 6) and Their Benzo-derivatives by Solvent Extraction. Anal Sci 24: 999-1003.
- Kudo Y, Fujihara R, Katsuta S, Takeda Y (2007) Solvent Extraction of Sodium Perrhenate by 3m-Crown-m Ethers (m = 5, 6) and Their Mono-benzo-derivatives into 1,2-Dichloroethane: Elucidation of an Overall Extraction Equilibrium Based on Component Equilibria Containing an Ion-pair Formation in Water. Talanta 71: 656-661.
- Terada H (1981) The Interaction of Highly Active Uncouplers with Mitochondria. Biochim Biophys Acta 639: 225-242.
- Shanonn RD (1976) Revised Effective Ionic Radii and Systematic Studies of Interatomic Distances in Halides and Chalcogenides. Acta Cryst A32: 751-767.
- Kielland J (1937) Individual Activity Coefficients of Ions in Aqueous Solutions. J Amer Chem Soc 59: 1675-1678.
- Kudo Y, Katsuta S, Takeda Y (2012) Evaluation of Overall Extraction Constants for the Crown Ether-Complex Ions of Alkali and Alkaline-Earth Metal with Counter Picrate Ions from Water into Nitrobenzene Based on Their Component Equilibrium Constants. J Mol Liq 173: 66-70.
- Iwachido T, Minami M, Sadakane A, Tôei K, (1977) The Coextraction of Water into Nitrobenzene with Alkaline Earth 2,2’,4,4’,6,6’-Hexanitrodiphenylaminates in the Presence of Crown Ethers. Chemistry Letters 1511-1514.
- Kudo Y, Miyakawa T, Takeda Y, Matsuda H (1995) Ion-transfer Polarographic Study of the Distribution of Alkali and Alkaline-Earth Metal Complexes with 3m-Crown-m Ether Derivatives (m = 6, 8) between Water and Nitrobenzene. J Inc Phenom Mol Recogn Chem 26: 331-341.
- Kudo Y (2015) On the Expression of Extraction Constants without Equilibrium Interfacial Potential Differences. Review of Polarography 61: 87-92 (in Japanese).
Citation: Kudo Y, Kaminagayoshi A, Ikeda S, Yamada H, Katsuta S (2016) Brief Determination of Standard Formal Potentials for the Transfers of Several Pairing Anions across the Nitrobenzene/Water Interface by Na(I) Extraction with 18-Crown-6 Ether. J Anal Bioanal Tech 7:319. Doi: 10.4172/2155-9872.1000319
Copyright: © 2016 Kudo Y, et al. This is an open-access article distributed under the terms of the Creative Commons Attribution License, which permits unrestricted use, distribution, and reproduction in any medium, provided the original author and source are credited.
Share This Article
Open Access Journals
Article Tools
Article Usage
- Total views: 9931
- [From(publication date): 6-2016 - Apr 24, 2024]
- Breakdown by view type
- HTML page views: 9248
- PDF downloads: 683