Effect of Physico-Chemical Parameters on Species Biodiversity with Special Reference to the Phytoplankton from Muthupettai, South East Coast of India
Received: 11-Mar-2014 / Accepted Date: 21-Apr-2014 / Published Date: 24-Apr-2014 DOI: 10.4172/2157-7617.1000200
Abstract
Plankton doesn't care about borders they moving independently in the aquatic ecosystem. The phytoplanktons are a function of many of the some environmental processes that affect species diversity. Study of the physicochemical parameters is important for the effects on phytoplankton productivity. The coastal zone is also a dynamic area with many cyclic and random processes owing to a variety of resources and habitats. Studies of the abundance, distribution and composition of phytoplankton communities are, therefore, a fundamental contribution to our understanding of the structure and function of marine ecosystems. In many coastal systems, primary production is almost entirely a function of the phytoplankton. In the present study totally 46 species were recorded, the maximum species was recorded in Coscinodisceae (14) followed by Chaetoceraceae (8) > Biddulphoidae (6) > Naviculaceae (6) > Triceratiinae (4) > Solenoidae (4) > Fragilariaceae (2) > Euodicidae(1) > Eucambiinae (1) respectively. The maximum of species was recorded in Coscinodisceae and minimum was recorded species in different for sampling stations.
Keywords: Physico-chemical; Phytoplankton; Mangrove; Inhabitants; Diversity recorded
Introduction
Marine environment as a complex ecosystem with influenced by able to physical, chemical and biological processes. An important study of ecology is to understand the factors that play a role in the distribution pattern of organisms. Phytoplankton in a marine environment is an important biological indicator of the water quality. They constitute the basis of food chain composition in aquatic environment as they play the role of primary producer and serve as food for aquatic animals such as zooplankton, shellfish and finfish [1-3] and also play an important role in maintaining the biological balance and quality of water. The basis of the food chain in marine water, some species on the other hand can be harmful to human and other vertebrates by releasing toxic substances into the water. They have a short life span and responds quickly to environmental changes [2]. The phytoplankton study and monitoring are useful for control of the physico-chemical and biological conditions of the water in any irrigation development. During the last few decades, there has been much interest in the processes influencing the development of phytoplankton communities, primarily in relation to physico-chemical factors [4]. The mangrove leaves decaying are also used as primary food source, which maintain zoea, larval and juvenile stocks. Influence of physical and chemical variables on planktonic communities in mangrove waters are more pronounced than the near shore coastal environment. In the phytoplankton species diversity responds rapidly to changes in the aquatic environment particularly in relation to nutrients [5]. This species distribution shows wide spatial temporal variations due to the different effect of hydrographical factors on individual species and they serve as good indicators of water quality [2,6]. Many factors reducing phytoplankton diversity may have direct detrimental effects on the amount and predictability of aquatic primary production. Previous studies indicate the physico-chemical parameters effect on the phytoplankton distribution [7-9] of Indian coastal environment. Hence the present study was carried out the physico-chemical parameters effect on the diversity of phytoplankton from Muthupettai mangrove environment.
Materials And Methods
This study was carried out in two different stations in (station 1) Lagoon and (station 2) Coastal regions from Muthupettai during the year of April 2008–March 2009. Muthupettai mangroves (Lat. 10° 25’N; Long. 79° 39’E) wetland of Vedaranyam area is located in the southern most end of the Cauvery delta in the districts of Nagapattinam, Thrivarur and Thanjavur and the situated 400 km South of Chennai lies along the South east coast of India. It has total area of 6800 ha in which the water spread area covers approximately 2720 ha. It has two specialized habitats were noted viz., lagoon and coastal. Many tributaries of the river Cauvery delta viz., Paminiyar, Koraiyar, Kilaithangiyar, Kandankurichanar and Marakkakoraiyar flows through Muthupettai and nearby villages and form a lagoon before they enter in to the sea, Bay of Bengal. Mangrove zone of the forest is restricted to the edges of the brackish water lagoon where the true mangrove species are distributed in varying degree of abundance. Avicennia marina is the most common and abundant species, which is followed by Excocaeria agallocha, Aegiceras corniculatum, Acanthus ilicifolius, Suaeda maritima, Suaeda monica Rhizophora mucronatoa and Lumnitzera racemosa. The species diversity in Muthupet is dominated by single species Avicennia marina constituting more than 95% of the total population. The northern and western borders of the lagoon are occupied by muddy silt ground which is devoid of mangroves. The mangroves beyond Muthupet Lagoon are discontinuously found along the shore and extended up to Point Calimere.
Muthupet reserve forest covers the lagoon, river creeks and the mudflats. Muthupet Lagoon (mullipallam) is a spectacular natural creation, which is 8 km from nearby Muthupet town and can be reached only by boat. The lagoon is shallow with an average depth of 1 m. The bottom of the lagoon is formed of silt clay substratum. The tidal fluctuations can be observed well with the exposure of oyster beds and roots during low tide. At 100–150 m in width and 5–6 km in length, the density of mangroves in eastern side of Muthupet lagoon is comparatively lower than other areas. Tamil Nadu Forest Department has excavated several canals across the mudflat. Each main canal, which enhances the water movement between sea and lagoon, has several subcanals on either side with a substantial number of mangrove seedlings. The western side has a protruding land pocket has formed an islet-like structure. This part of the lagoon lies near Koraiyar river mouth with small mangrove patches.
The water samples were collected at monthly interval at two different stations, lagoon (Station I) and coastal (Station II) for a period of one year from April 2008–March 2009 to analyze various physical and chemical parameters. Rainfall data for the study area was collected from the meteorological unit. Tide level was measured using graduated wooden pole, the atmospheric and water temperature were measured using a digital centigrade thermometer. Salinity was estimated with the help of a hand refractrometer (ERMA, Japan) and pH was measured using an ELICO Grip pH meter. Light penetration in the water column was measured with the help of a Secchi disc and the Light Extinction Co-Efficient (LEC), Dissolved oxygen was estimated by the modified Winkler's method [10]. For the analysis of nutrients, surface water samples were collected in clean polythene bottles and kept immediately in an icebox and transported to the laboratory. The water samples were than filtered using a millipore filtering system and analyzed for dissolved inorganic phosphate, nitrate, nitrite, ammonia and reactive silicate by adopting standard procedure of [10].
Results
Rainfall
Total rainfall recorded from the study area was 1001 mm to 1200 mm. There was no rainfall during January and April. Maximum rainfall was recorded during the month of November (342.0 mm). A cyclonic storm during the monsoon season accounted for the highest total rainfall recorded during the first phase than the latter.
| S.No | SPECIES | St I | St II |
|---|---|---|---|
| I | Bacillariaphycea (diatoms) | Cells/1 | |
| Family : Coscinodisceae | |||
| 1 | Coscinodiscus apiculatus | + | + |
| 2 | Coscinodiscus centralis | * | * |
| 3 | C. centralis | + | ++ |
| 4 | C.concetricus | + | + |
| 5 | C.granii | + | + |
| 6 | C.gigas | +++ | +++ |
| 7 | C.radiatus | + | + |
| 8 | C.thori | * | + |
| 9 | Cyclotella sp | +++ | ++ |
| 10 | Diploneis sp. | + | + |
| 11 | Planktoniella sol | + | +++ |
| 12 | Planktoniella sp | ++ | +++ |
| 13 | Skeletonema costatum | + | ++ |
| 14 | Thalassiosira sp | +++ | +++ |
| II | Family: Triceratiinae (Diatoms) | ||
| 1 | Ditylum brightwelli | ++ | +++ |
| 2 | Ditylum sp | +++ | + |
| 3 | Triceratium reticuatum | * | +++ |
| 4 | Triceratium sp | +++ | ++ |
| III | Family: Chaetoceraceae (Diatoms) | ||
| 1 | Chaetoceros affinis | * | + |
| 2 | C. curvicetus | ++ | ++ |
| 3 | C.decipiens | ++ | +++ |
| 4 | C. messanensis | + | + |
| 5 | C.diversus | ++ | +++ |
| 6 | C.indicus | + | +++ |
| 7 | C.comosum | * | + |
| 8 | Bacteriostrum furcatum | ++ | + |
| IV | Family: Biddulphoidae (Diatoms) | ||
| 1 | Biddulphia biddulphia | + | +++ |
| 2 | B.heteroceros | * | +++ |
| 3 | B.reticulata | ++ | +++ |
| 4 | B. pulchella | + | +++ |
| 5 | Odentella sinensis | ++ | +++ |
| 6 | O.mobiliensis | + | ++ |
| V | Family:Eucambiinae (Diatoms) | ||
| 1 | Eucambia sp | * | + |
| VI | Family: Solenoidae (Diatoms) | ||
| 1 | Leptocylindrus danicus | * | + |
| 2 | Rhizosolenia cylindrus | ++ | +++ |
| 3 | R.imbricata | + | ++ |
| 4 | R. styliformis | ++ | + |
| VIII | Family: Euodicidae (Diatoms) | ||
| 1 | Hemdiscus sp | + | + |
| IX | Order:Pennales (Diatoms) | ||
| Family: Naviculaceae | |||
| 1 | Pleurosigma angulatum | + | ++ |
| 2 | P.elongatum | ++ | +++ |
| 3 | P.depressum | + | +++ |
| 4 | Nitzshia longissima | + | + |
| 5 | Pseudo-nitzschia sp. | * | + |
| 6 | Navicula sp | ++ | +++ |
| X | Family:Fragilariaceae (Diatoms) | ||
| 1 | Thalassiothrix sp | ++ | +++ |
| 2 | Rhabdonema arcuatum | + | ++ |
Table 1: List of phytoplankton species in Muthupettai during April 2008 – March 2009.0
Atmospheric temperature
The atmospheric temperature minimum was recorded 28.0°C and 27.0°C during the monsoon period in the month of December at Station-I and Station-II and maximum was recorded 33.0°C and 31.5°C during summer in the month of April at Station-I and Station-II (Figure 1).
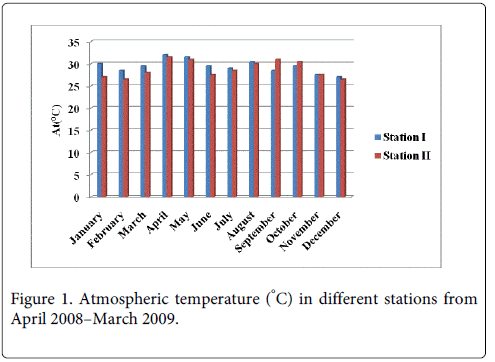
Figure 1: Atmospheric temperature (°C) in different stations from April 2008–March 2009.
Water temperature
The water temperature minimum was recorded 28.0°C and 27.0°C during the monsoon period in the month of December at station-I and station-II and maximum was recorded 32.5°C and 32.0°C during summer in the month of April at station-I and station-II (Figure 2).
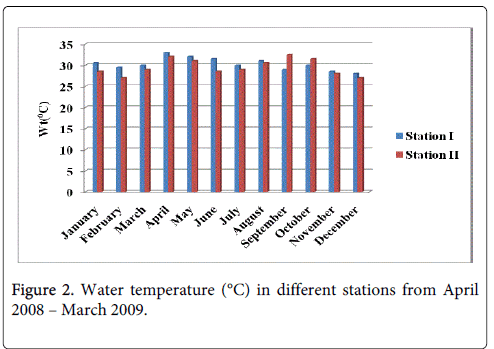
Figure 2: Water temperature (°C) in different stations from April 2008 – March 2009.
Salinity
The salinity minimum 27.5ppt and 26.5 was recorded during the monsoon in the month of December at station-I and station-II and maximum 35.0 ppt and 32.0 ppt salinity was recorded during summer in the month of April at station-I and station-II respectively. Both the station showed similar seasonal pattern in salinity distribution and recorded low values during the monsoon season and high during the summer season (Figure 3).
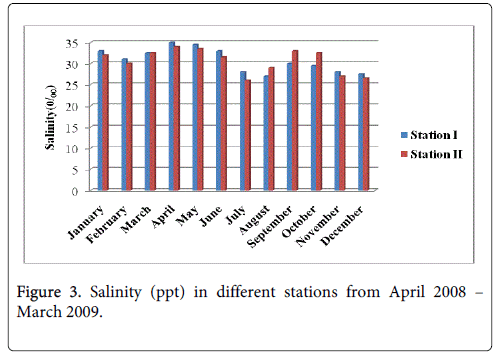
Figure 3: Salinity (ppt) in different stations from April 2008 – March 2009.
pH
The pH minimum was recorded 7.8 and 7.9 during the monsoon season in the months of November and December at station-I and station-II and maximum was recorded 8.2 and 8.1 during summer in the month of April at station-I and station-II (Figure 4).
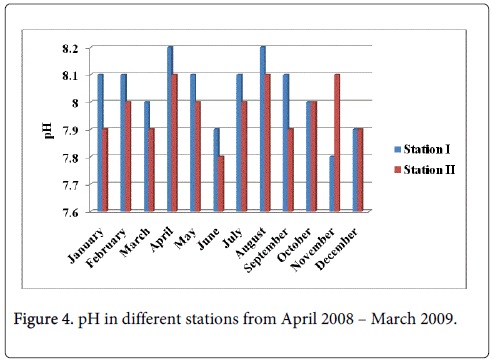
Figure 4: pH in different stations from April 2008 – March 2009.
Turbidity (NTU)
The turbidity minimum was recorded 27.0 and 28.0 during the summer season in the month of April at station-I and station-II and maximum was recorded 35.0 and 34.0 during monsoon season in the month of December at station-I and station-II (Figure 5).
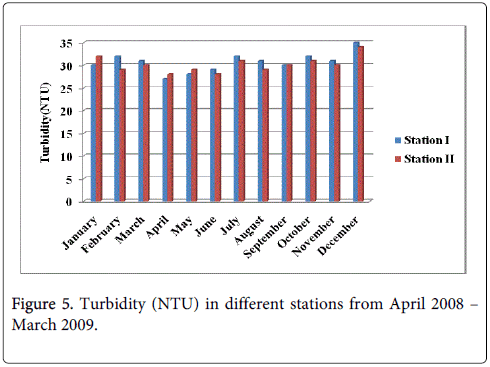
Figure 5: Turbidity (NTU) in different stations from April 2008 – March 2009.
Dissolved oxygen
The dissolved oxygen minimum was recorded 0.875 mg1/l and 0.752 mg1/l during the summer season in the month of June at station-I and station-II and maximum was recorded 2.631 mg1/land 2.512 mg1/l during the monsoon season in the month of December at station-I and station-II (Figure 6).
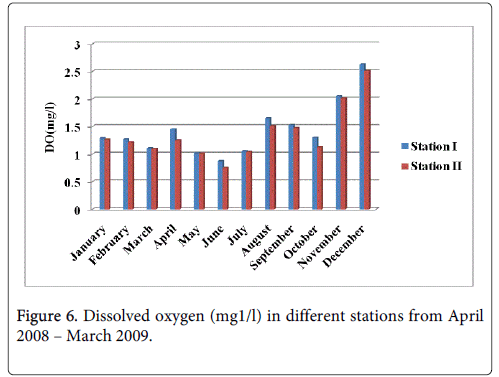
Figure 6: Dissolved oxygen (mg1/l) in different stations from April 2008 – March 2009.
Biological oxygen demand
The BOD minimum was recorded 0.745 mg1/l and 0.621 mg1/l during monsoon season in the month of November at station-I and station-II and maximum was recorded 2.518 mg1/l and 2.301 mg1/l during the summer in the months of April and May at station-I and station-II (Figure 7).
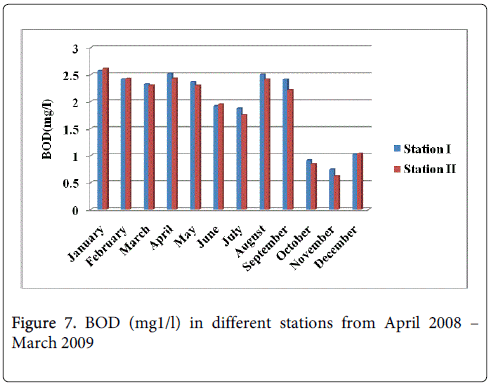
Figure 7: BOD (mg1/l) in different stations from April 2008 – March 2009
Chemical oxygen demand
The COD minimum was recorded 0.392 mg1/l and 0.371 mg1/l during the pre-monsoon period in the months of June and July at station-I and station-II and maximum was recorded 1.095 mg1/l and 1.081 mg1/l during the monsoon season in the month of November at station-I and station-II (Figure 8).
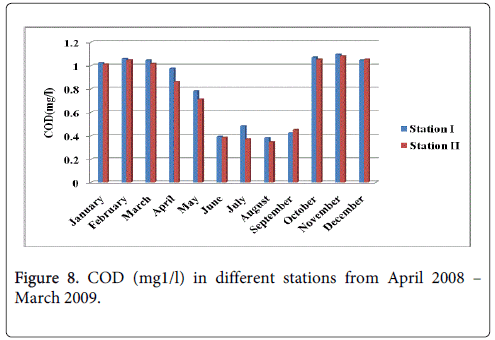
Figure 8: COD (mg1/l) in different stations from April 2008 – March 2009.
Nutrients
Nitrate
The nitrate minimum was recorded 0.927 mmol/l and 0.879 mmol/l during the summer season in the month of April at station-I and station-II maximum was recorded 7.124 mmol/l and 7.032 mmol/l monsoon season in the month of November at station-I and station-II (Figure 9).
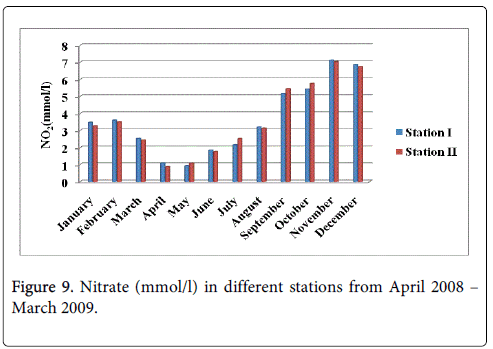
Figure 9: Nitrate (mmol/l) in different stations from April 2008 – March 2009.
Nitrite
The nitrite minimum was recorded 0.374 mmol/l and 0.318 mmol/l during the summer period in the months of May and April at station-I and station-II and maximum was recorded 2.674 mmol/l and 2.598 mmol/l during the monsoon season in the month of November at station-I and station-II (Figure 10).
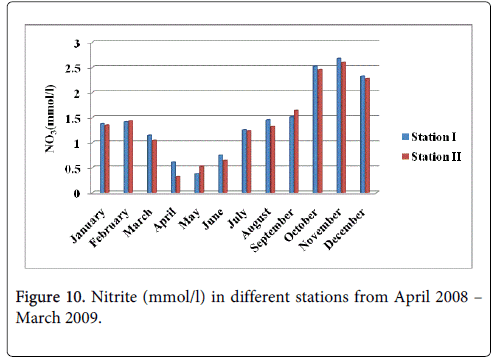
Figure 10: Nitrite (mmol/l) in different stations from April 2008 – March 2009.
Ammonia
The ammonia minimum was recorded 0.716 mmol/l and 0.694 mmol/l during summer period in the month of April at station-I and station-II and maximum was recorded 3.423 mmol/l and 3.251 mmol/l during monsoon in the month of November at station-I and station-II (Figure 11).
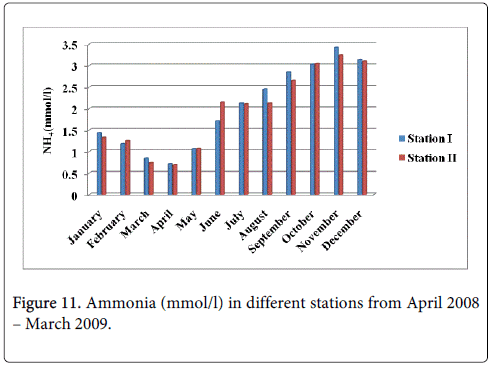
Figure 11: Ammonia (mmol/l) in different stations from April 2008 – March 2009.
Total Nitrogen
The total nitrogen minimum was recorded 12.67 mmol/l and 11.83 mmol/l during summer period in the months of April and May at station-I and station-II and maximum was recorded 24.54 mmol/l and 23.51 mmol/l during monsoon in the month of November at station-I and station-II (Figure 12).
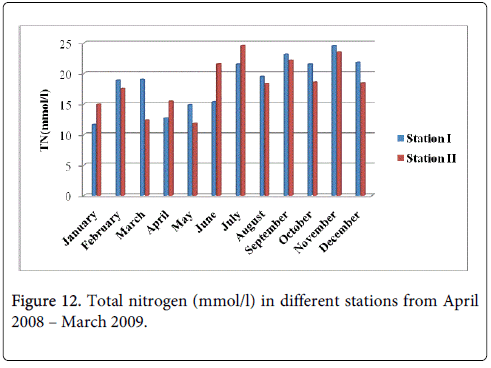
Figure 12: Total nitrogen (mmol/l) in different stations from April 2008 – March 2009.
Inorganic phosphate
The inorganic phosphate minimum was recorded 1.019 mmol/l and 1.012 mmol/l during summer seasons in the month of June at station-I and station-II and maximum was recorded 3.512 mmol/l and 3.418 mmol/l during monsoon in the month of November at station-I and station-II (Figure 13).
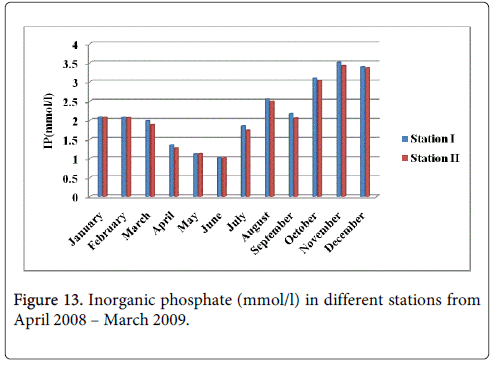
Figure 13: Inorganic phosphate (mmol/l) in different stations from April 2008 – March 2009.
Total Phosphorous
The total phosphorous minimum was recorded 0.842 mmol/l and 0.729 mmol/l during summer period in the month of May at station-I and station-II and maximum was recorded 2.145 mmol/l and 2.134 mmol/l during monsoon in the month of November at station-I and station-II (Figure 14).
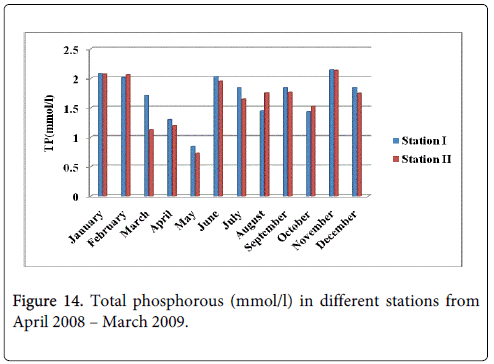
Figure 14: Total phosphorous (mmol/l) in different stations from April 2008 – March 2009.
Reactive silicate
The reactive silicate minimum was recorded 1.167 mmol/l and 1.153 mmol/l during summer period in the month of May at station-I and station-II and maximum was recorded 2.952 mmol/l and 2.855 mmol/l during monsoon in the month of November at station-I and station-II (Figure 15).
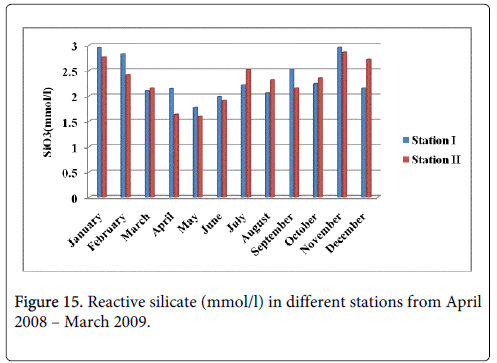
Figure 15: Reactive silicate (mmol/l) in different stations from April 2008 – March 2009.
Discussion
In the present study totally 46 species were recorded, the maximum species was recorded in Coscinodisceae (14) followed by Chaetoceraceae (8) > Biddulphoidae (6) > Naviculaceae (6) > Triceratiinae (4) > Solenoidae (4) > Fragilariaceae (2) > Euodicidae (1) > Eucambiinae (1) respectively. Among the two different stations the contributions of species in station 1, the maximum was observed Coscinodisceae (12) followed by Chaetoceraceae (6) > Biddulphoidae (5) > Naviculaceae (5) > Triceratiinae (3) >Solenoidae (3) > Fragilariaceae (2) >Euodicidae (1). The station II maximum species was recorded in Coscinodisceae (13) followed by Chaetoceraceae (8) >Biddulphoidae (6) > Naviculaceae (6) >Triceratiinae (4) > Solenoidae (4) > Fragilariaceae (2) > Euodicidae (1). Similar study was made in previous studies, In India, such studies have been carried out from the east and west coasts. Venkataraman [11] studied the systematic account of some south Indian diatoms. A collection of information with respect to phytoplankton dynamics is available from Trivandrum coast Menon [12], Subrahmaniyan [13] reported the phytoplankton preliminary and systematic characterization from madras coast. Prasad [14] studied the shore waters phytoplankton from Gulf of Mannar. Subrahmanyan [15] reported that the phytoplankton organisms of the Arabian Sea off the west coast of India. Mani [16] studied the ecology of phytoplankton blooms in the Vellar estuary, east coast of India. Edward [17] studied the ecology of plankton community of Kollidam estuary, southeast coast of India. Kannan [18] has reported a total number of 126 species of phytoplankton from Manoli and Hare islands of the Gulf of Mannar. Banse [19] reported the possible causes of the seasonal phytoplankton blooms along the southeast coast of India. Krishnamoorthy [20] reported that the west coast current and conglomeration of Open Ocean influenced the highest species diversity of meroplankton in the Palk Bay and Gulf of Mannar. Sarojini [21] reported that the vertical distribution of phytoplankton around Andaman and Nicobar Islands, Bay of Bengal. Senthilkumar [22] studied the diversity of phytoplankton in Vellar estuary, southeast coast of India. Santhanam [23] studied the diversity of zooplankton in Parangipettai coastal waters, southeast coast of India. Geetha [24] reported the distribution of phytoplankton in the coastal waters of east coast of India. Sridhar [9] reported the seasonal behavior of distribution of phytoplankton in the Palk Bay region. Paul [25] reported the nutrient regimes and their effect on distribution of phytoplankton in the Bay of Bengal.
Rainfall is the most important cyclic phenomenon in tropical countries as it brings about important changes in the physical and chemical characteristics of the coastal and estuarine environments. In the present study, peak values of rainfall were recorded during the monsoon season in November. Since the study area was received bulk rainfall during the northeast monsoon. The oceans are normally a natural carbon sink, absorbing carbon dioxide from the atmosphere. Because the levels of atmospheric carbon dioxide are increasing, the oceans are becoming more acidic. The potential consequences of ocean acidification are not fully understood, but there are concerns that structures made of calcium carbonate may become vulnerable to dissolution, affecting corals and the ability of shellfish to form shells. The present study maximum air temperature was recorded during the summer season owing to the clear sky with some more solar radiations. Less solar radiation with cloudy sky and more rainfall during the monsoon season greatly reduced the air temperature. Surface water temperature largely depends on the intensity of solar radiation, evaporation, insolation, freshwater influx and cooling and mix up with ebb from adjoining neritic waters. The phytoplankton reproduction rates are closely linked to temperature and there determined the level of growth [26-28]. The increase assimilation rates of nutrients at lower temperatures and subsequently increases biomass. It could have a remarkable impact on regulating the ocean carbon cycle not only by the direct uptake of carbon dioxide but also by affecting the solubility of carbon dioxide into the ocean which is temperature dependent. In the present study, summer peaks and monsoonal troughs in air and surface water temperatures were observed by several workers from southeast coast of India [28-30]. Tides controlled changes in temperature are distinct during monsoons month, but during other months heating of the surface water by solar radiation greatly over shadowed the small changes in temperature such as those induced by tides.
The salinity acts as a major ecological factor in the distribution of living organisms and its variation caused by dilution and evaporation is most likely to influence the faunal distribution of the coastal ecosystems [31]. High salinity during summer in the stations could be attributed to high degree of evaporation of surface water. During the monsoon season, the stations received bulk rainfall and freshwater input, which in turn greatly reduced the salinity values [32]. Presently, there were no such wide salinity variations. The salinity was also found to be high during summer season and low during the monsoon season at the stations, higher rate of evaporation and also due to neritic water dominance, as reported by earlier workers in other areas [33]. The phytoplankton do need some salinity in order to survive, While salinity has been known to have a positive impact on the growth of algal blooms high salinity has been known to stunt algae growth. The salinity of water can affect the photosynthetic ability of phytoplankton and affect nitrogen fixation [9]. Light intension co-efficient at both the stations was high during the monsoon season due to the monsoonal rains coupled with low intensity of solar radiation and higher concentration of dissolved organic matter and suspended sediments, which resulted in increased turbulence in the water. Post monsoon season at the stations due to the removal of suspended materials from the water column and cessation of freshwater flow reducing the abiogenic turbidity. The photosynthetic response of phytoplankton to available of light is not constant, but varies according to the physiology of the cells, pigments also absorb light. The phytoplanktons are experience the greatest productivity when they encounter their optimal light and photosynthesis is inhibited with increasing light levels. The phytoplankton abundance and biomass greatly increase during the summer months in higher latitudes because of the increased amount of light. Similar findings were reported from the different coastal environment [26,27].
Generally, fluctuations in pH values during different months of seasons of the year in attributed to factors like removal of CO2 by photosynthesis through bicarbonate degradation, dilution of seawater by freshwater influx, low primary productivity, reduction of salinity and temperature besides decomposition of organic materials as stated by Rajasegar [33]. pH remained alkaline throughout the study period in both the stations with minimum values during the summer season. However pH fluctuated from month to month and from one tide to other without any definite pattern. Tidal and surface bottom differences in pH values were not pronounced. The uptake of CO2 by the photosynthesizing organisms especially phytoplankton from the sea could have increased the pH levels during summer season. The high pH recorded might be due to the influence of seawater penetration and high biological activity [26] and due to the occurrence of high photosynthetic activity [34]. pH was also quit low during floods in the peak monsoon season due to the influence of freshwater influx, dilution of saline water, reduction of salinity and temperature and decomposition of organic matter [35].
The turbidity purports to measure approximately the same water quality property as total suspended solids, the latter is more useful because it provides an actual weight of the particulate material present in the sample concentrations of suspended solids degrade optical water quality by reducing water clarity and decreasing light available to support photosynthesis [22,27]. Suspended solids also influence metabolic activity and provide surface area for the sorption and transport of an array of constituents. Deposited solids alter streambed properties and aquatic habitat for fish, macrophytes, and benthic organisms. Deposited sediment may be available for re-suspension and subsequent transport during periods of increased stream discharge. Suspended solids in most freshwater systems originate from watershed sources, pollutant point sources, and sediment re-suspension. Because turbidity readings are somewhat dependent on particle size, shape, and color, this approach requires calculating a correlation equation for each location. Further, situations or conditions that tend to suspend larger particles through water motion (e.g., increase in a stream current or wave action) can produce higher values presence of suspended and some dissolved substances, which causes incident light to be scattered, reflected, and attenuated rather than transmitted in straight lines; the higher the intensity of the scattered or attenuated light, the higher the value of turbidity. The effects of grain size, color, and mineral composition need to be defined and documented. These effects probably can be calibrated with suspended-sediment samples collected over the range in turbidity conditions at the same time that continuous turbidity measurements are made [25-27].
This parameter is more critical because it shows whether there is sufficient oxygen in the water for marine life to survive. The actual dissolved oxygen content reflects the equilibrium between re-aeration at the surface added to photosynthetic oxygen generated by chlorophyll in the water body, minus the biological and any chemical oxygen demand. The dissolved oxygen concentration was low during the post monsoon season at both the stations and it increased during monsoon seasons. The low dissolved oxygen concentration observed during the post monsoon season could be attributed to the lesser input of freshwater into the study areas. This could be due to the microbial utilization of oxygen and cessation of freshwater input, Bijoy [36] suggested that very high organic load would result in greater microbial decomposition and depletion of oxygen with BODs values and eventually from a state of anoxia. Seasons and low BODs values recorded during the monsoon season at both the stations indicated effective assimilation of organic load [36]. Saraswathi [37] has also reported similar pattern of seasonal variations in BOD in the Arasalar and Kavery estuaries. In the present investigation, maximum COD values were observed during summer seasons due to the decrease in freshwater inflow, land drainage sewage input and increases in salinity, temperature and phytoplankton productivity and microbial utilization of oxygen at the time of decomposition. Low chemical oxygen demand was observed during the monsoon season due to the presence of heavy river run off, increased mixing of agricultural and domestic wastes, land drainage into the coast and decreased biological activity due to decreased salinity and temperature. COD values observed presently are very low when compared to the values as reported by Saraswathi [37] from the Arasalar and Kavery estuaries. Chemical Oxygen Demand (COD) determines the oxygen required for chemical oxidation of organic matter with the help of strong chemical oxidant. Maximum were observed during the pre-monsoon and monsoon respectively due to low rainfall and increase in salinity, temperature, phytoplankton productivity and microbial utilization of oxygen at the time of decomposition. It is well known that the temperature and salinity affect the dissolution of oxygen [38]. In the present investigation, a higher value of dissolved oxygen was recorded during the month of February at the stations. The observed high values might be due to the cumulative effect of higher wind velocity and the resultant freshwater mixing [38,39].
The present study coliform bacteria concentration in the natural of coastal environment, although these microorganisms are not pathogenic and exist naturally in human intestines, their presence indicates pollution due to urban sewage effluents. However, doubts have been voiced about the suitability of this parameter as an indicator of pathogenic potential in coastal waters [40]. Furthermore, whereas coliforms are of human origin, some opportunistic pathogens also often originate from non-fecal sources and can grow naturally in various waters. Upon discharge into the water body environmental conditions such as temperature and sunlight determine the eventual fate of coliform bacteria through a multitude of processes. In fact, coastal areas at the deltas of large rivers typically suffer from anoxic conditions due to oxygen demand from the large sediment and that required for the transport of biological matter. This is in addition to the polluting effects of any other organic or inorganic nutrients carried by the river. The concentration of nutrients (ammonia, nitrates, phosphates, inorganic nitrogen or phosphorus) is linked directly to non-point source runoff from agricultural watersheds as a consequence of soil fertilization, insecticide or pesticide spraying, and so on. Nutrients are metabolised by marine microorganisms and the inorganic elements are fixed to more complex compounds. Algae play a very important role in these processes, enhancing water denitrification (release of N2 to the atmosphere) or nitrification (capture of N2 from air). Nutrients are considered as one of the most important parameters in the marine environment by influencing the growth, reproduction and metabolic activities of living beings. Nutrients, more importantly the nitrate and silicate have emerged as the main factors controlling the phytoplankton growth reported [41]. The availability of dissolved silicate may be equally or more important, because diatoms are dependent upon it while the vast majority of non-diatoms are not. Distribution of nutrients is mainly based on the season, tidal conditions and freshwater flow from land source. Eutrophication is an increase in the concentration of chemical nutrients in an ecosystem to an extent that increases the primary productivity of the ecosystem. Depending on the degree of eutrophication, subsequent negative environmental effects such as anoxia and severe reductions in water quality, fish, and other animal populations may occur [18,21,27].
The recorded higher nitrite valued during monsoon season mainly in the month of November could be due to the increased planktonic excretion, oxidation of ammonia and reduction of nitrate and by recycling of nitrogen and also due to bacterial decomposition of plankton detritus present in the environment [42]. Further, the denitrification and air-sea interaction exchange of chemicals are also responsible for this increased value [43]. The low nitrite value recorded during summer season (May) may be due to less freshwater inflow and high salinity. Nitrite concentration at both the stations was high during monsoon seasons and low during post monsoon. The peak values of nitrite observed during the monsoon season could be attributed to the influence of seasonal floods as observed for phosphate and nitrate. Further, excretion of phytoplankton, reduction of nitrate and oxidation of ammonia could all contribute together or individually to increase the concentration of nitrite in the environment. The recorded highest nitrate value during monsoon season could be mainly due to the organic materials received from the catchments areas during ebb tide [26]. The increased nitrates level was due to fresh water inflow and terrestrial run-off during the monsoon season [23]. Another possible way of nitrates entry is through oxidation of ammonia form of nitrogen to nitrite formation [33]. Ammoniac compounds are antagonistic to nitrates, as both compete for algal uptake. On the other hand, the simultaneous presence of phosphorus enhances algal growth, leading to eutrophication, that is, abnormal growth of algae and marine flora. This is particularly troublesome in enclosed waters, but also occurs in coastal areas suffering from large pollution inflows and suppressed natural circulation and flushing. High concentration of nitrate observed during the monsoon season might be due to the heavy rainfall, resultant river run-off, land drainage and input of fertilizers from the adjacent agricultural fields and oxidation of ammonia. The minimum concentration of nitrate observed during the summer season could be due to its utilization by phytoplankton as evidenced their high population density and also decreased freshwater flow during this period [30]. Higher concentration of ammonia was observed during the monsoon season in both the stations particularly in the month of November. Lower concentration of ammonia was observed during the summer season in both stations, mainly in the month of May. The recorded higher concentration could be partially due to the death and subsequent decomposition of phytoplankton and also due to the excretion of ammonia by plankton as opined by Segar [44]. Eutrophication is also a common phenomenon in marine, coastal waters. In contrast to freshwater systems, nitrogen is more commonly the key limiting nutrient of marine waters, thus nitrogen levels have greater importance to understanding eutrophication problems in salt water. Estuaries tend to be naturally eutrophic because land-derived nutrients are concentrated where run-off enters the marine environment in a confined channel. In the present study total nitrogen in water was high during in the monsoon season in the stations particularly in the month of November. Lower concentration was observed in the month of August respectively. The recorded higher concentration of nitrogen released from the decay of a large number of phytoplankton.
The high concentration of inorganic phosphates was recorded during monsoon season mainly in November month, might possibly be due to intrusion of upwelling seawater, which in turn increased the level of phosphate. Further, regeneration and release of total phosphorus from bottom mud into the water column by turbulence and mixing is also attributed to the recorded higher monsoonal values. The low phosphate value recorded in summer season mainly in June month could be attributed to the high utilization of phosphate by phytoplankton and also the variation may also be due to the processes like adsorption and desorption of phosphate and buffering action of sediment under varying environmental conditions [33]. High concentration of phosphate observed in the present study during monsoon season might have resulted from the regeneration of phosphate from the bottom muds and subsequent release of the same in water column by turbulence and mixing caused by heavy winds prevailing during rainy season. Low concentration of phosphate observed during the post monsoonal season due to the decreased land drainage, sewage and fertilizer disposal from the agricultural lands. Such monsoonal maximum and post monsoon minimum in phosphate concentration was also reported from Porto-Novo waters [30]. The regeneration of phosphorus in bottom mud and mixing caused by heavy wind, may also have contributed to the higher value observed during monsoon season. The low values of phosphorus are recorded during summer season due to utilization by phytoplankton which was higher density during this season. The silicate content was higher than the other nutrient NO3, NO2 and inorganic phosphate. The maximum values recorded in monsoon season mainly in the month of November may be due to heavy inflow of monsoonal fresh water derived from land drainage carrying silicate leached out from rocks. Further, due to the turbulent nature of water, the silicate from the bottom sediment might have been exchanged with overlying water [33]. In addition to phytoplankton uptake, some other processes like absorption and co-precipitation of soluble silicon might also govern the distribution of dissolved silicate in the environment [43] .The low summer values could also be attributed to uptake of silicates by phytoplankton for their biological activity. Vengadesh [3] observed the variation in phytoplankton population and biomass can be related to the changes in water quality. Paramasivam [8] reported that the physico-chemical characteristics of pH, dissolved oxygen, alkalinity and the dissolved nutrients are important for the phytoplankton production from Muthupettai mangrove environment. Sridhar [9] reported the biological assessment of water pollution in the Palk bay using phytoplankton community structure and species distribution. Sarojini [21] reported that the diversity of phytoplankton and its relationships to the physico-chemical environment were studied in Andaman and Nicobar Islands, Bay of Bengal. Geetha [24] studied the distribution of phytoplankton in the coastal waters of east coast of India. [33] studied the phytoplankton diversity associated with the shrimp farm development in Vellar estuary. Subramanian [34] observed that the influencing the development of phytoplankton communities, primarily in relation to physico-chemical factors. Several studied have discussed the effects of environmental factors on phytoplankton diversity [30,35]. The phytoplankton refers to the autotrophic component of the plankton that drifts in the water column [45], Algal biodiversity in marine water and related physico-chemical factors were studied. Subramanyan [46] studied the phytoplankton community structure are mainly due to changes in environmental variables were studied west coast of India. The qualitative and quantitative studied of phytoplankton have been utilized to assess the quality of water. Marichamy [47] studied on primary and secondary production in relation to hydrography in the inshore waters of Tuticorin. Kawabata [48] studied the seasonal variations of phytoplankton is related to a variety of environmental factors in aquatic environments. Govindasamy [42] studied the seasonal variation in physico-chemical properties and primary production in the coastal water biotopes of Coromandel Coast. Gouda [49] studied the seasonal distribution of phytoplankton in Nethravathi estuary, Mangalore.
In the present study observed due to the coastal environment analysis varies water quality parameters and different season variations also discussed. Mostly this coastal environment the change of nutrient concentration in tidal waters would also increase due to drainage, wind, tide and shallowness of the water system. Eutrophication generally promotes excessive plant growth and decay, favours simple algae and plankton over other more complicated plants, and causes a severe reduction in water quality. Mostly, disrupts normal functioning of the ecosystem, causing a variety of problems such as a lack of oxygen in the water, needed for fish and shellfish to survive. Phytoplanktons are extremely important from the standpoint of monitoring water quality since they are the first group to respond to changes in nutrient conditions in an ecosystem. Although the important of nutrients in phytoplankton production of coastal environment. There is still exists differences of opinion among ecologists as to which nutrients limits productivity of phytoplankton community. Available nitrogen (NO2+NO3+NH4) on most instances has been attributed to limit phytoplankton production, but certain cases phosphorus has been found to limit plant production in coastal environment. The higher concentration of nitrite and seasonal variation could be attributed due to the variation in phytoplankton, excretion and oxidation of ammonia and reduction of nitrite. The purpose of this study has been to determine the effect of drainage system and type of land use on the load of mineral nutrient compounds derived from soil environment and present in water ecosystems. As water originating from rain and snow is the main medium shaping soil processes and transport of minerals, particular attention has been paid to variations in atmospheric precipitation during the analyzed time period. In the present study tidal and diurnal variations in a large spectrum of nutrients fraction, which included dissolved oxygen reactive phosphorus, nitrite, nitrate and reactive silicate was irrigates for this coastal environment. Hence, it can be concluded that the coastal zones and lagoons are important ecological systems and a reserve for an assortment of uses. Such areas are subjected to a variety of socio-economic drivers, producing increased impacts, which are able to direct to environmental stress and still affect public health. The knowledge of water quality changes in coastal areas is an important component for monitoring and management activities concerned with land use to detect the natural seasonal changes in the coastal waters and to identify the changes from anthropogenic input. The phytoplankton may be used as indicators of biological monitoring in the open sea and coastal area. They are affected by the changes in the water quality and the pollutants. The plankton population, abundance and species composition can be environmental indicators because of their sensitivity to environmental changes. But the routine biological monitoring of aquatic ecosystem is based largely on phytoplanktons, since the phytoplankton provide relatively unique information concerning ecosystem conditions. In the present study very useful tool for the assessment of water quality and also contributes to understanding of the phytoplankton species and general economy of the marine environment. Zooplankton, Fish, crab, shrimp, molluscs and others all are fasting, why, when there is grow phytoplankton. Coastal depends on the related activity people all are co-operate to the clear environment. Algal bloom is toxic substance to the waiting organisms including human being.
References
- Gowda G, Gupta TR, Mani P (1992) Natural phytoplankton communities in Pichavaram mangroves. Indian J Mar Sci 12: 278-280.
- Tiwari A, Chauhan SV (2006) Seasonal phytoplanktonic diversity of Kitham lake, Agra. J Environ Biol 27: 35-38.
- Perumal NV, Rajkumar M, Perumal P, Rajasekar KT (2009) Seasonal variations of plankton diversity in the Kaduviyar estuary, Nagapattinam, southeast coast of India. J Environ Biol 30: 1035-1046.
- Prasad R, Nair PV (1960) A preliminary account of primary production and its relation to fisheries of the inshore waters of Gulf of Mannar. Indian J Fish 7: 165-168.
- Robertson AI, Blabber SJ (1992) Plankton, epibenthos and fish communities. In: Tropical Mangrove Ecosystems. Coastal Estuar Stud 41: 173-224.
- Perumal P (1993) The influence of meteorological phenomena on the ecosystems of a tropical region, southeast coast of India. A case study. Cien Marinas 19: 343-351.
- Rajkumar M, Perumal P, Prabu VA, Perumal NV, Rajasekar KT (2009) Phytoplankton diversity in pichavaram mangrove waters from south-east coast of India. J Environ Biol 30: 489-498.
- Paramasivam S, Kannan L (2005) Physico-chemical characteristics of Muthupettai mangrove environment, Southeast coast of India. Inter J Ecol Environ Sci 31: 273-278.
- Sridhar R, Thangaradjou T, Kumar SS, Kannan L (2006) Water quality and phytoplankton characteristics in the Palk Bay, southeast coast of India. J Environ Biol 27: 561-566.
- Strickland JD, Parsons TR (1972) A practical hand book of seawater analysis. Bull Krish Res Bd Canada.
- Venkataraman GA (1939) Systematic account of some Indian diatoms. Proc Indian Acad Sci 10: 293-368.
- Menon MA (1945) Observations on the seasonal distribution of the plankton of the Trivandrum coast. Proc Indian Acad Sci Seel B 22: 31-62.
- Subrahmaniyan R (1946) The diatoms of the Madras coast. Proc Ind Acad Sci 24: 85-197.
- Prasad RR (1956) Further studies on the plankton of the inshore water of Mandapam. Wian J Fish 3: 1-42.
- Subrahmanyan R (1959) Studies on the phytoplankton of the west coast of India. Parts 1 and 2. Proc Indian Acad Sci Seel B 50: 113-252.
- Mani P, Krishnamurthy K (1989) Variation of phytoplankton in a tropical estuary (Vellar estuary, Bay of Bengal, India). In. Revue Ges Hydrobiol 74: 109-115.
- Edward PK, Ayyakkannu K (1991) Studies on the ecology of plankton community of Kollidam estuary, southeast coast of India: 1. Phytoplankton. Bull Natl Inst Oceanogr 24: 89-97.
- Kannan R, Kannan L (1996) Physico-chemical characteristics of seaweed beds of the Palk bay, Southeast coast of India. Ind J Mar Sci 25: 358-362.
- Banse K, Vijayaraghavann S, Madhupratap M (1996) On the possible causes of the seasonal phytoplankton blooms along the southeast coast of India. Ind J Mar Sci 25: 283-289.
- Krishnamoorthy P, Subramanian P (1999) Organisation of commercially supporting meroplankton in Palk Bay and Gulf of Mannar biosphere areas, southeast coast of India. Ind J Mar Sci 28: 211-215.
- Sarojini Y, Sarma NS (2001) Phytoplankton distribution in the sea around Andaman and Nicobar Islands at the onset of North East Monsoon. Sea Weed Res Util 23: 133-141.
- Senthilkumar S, Santhanam P, Perumal P (2002) Diversity of phytoplankton in Vellar estuary, southeast coast of India. In: Proc. 5th Indian Fisheries Forum (Eds.: S. Ayyappan, J.K. Jena and M. Mohan Joseph). Published by AFSIB, Mangalore and AeA, Bhubanewar, India.
- Santhanam P, Perumal P (2003) Diversity of zooplankton in Parangipettai coastal waters, southeast coast of India. J Mar Biol Ass India 45: 144-151.
- Geetha MV, Kondalarao B (2004) Distribution of phytoplankton in the coastal waters of east coast of India. Ind. J Mar Sci 33: 262-268.
- Paul JT, Ramaiah N, Sardessai S (2008) Nutrient regimes and their effect on distribution of phytoplankton in the Bay of Bengal. Mar Environ Res 66: 337-344.
- Das J, Das SN, Sahoo RK (1997) Semidiurnal variation of some physicochemical parameters in the Mahanadi estuary, east coast of India. Ind J Mar Sci 26: 323-326.
- Karuppasamy PK, Perumal P (2000) Biodiversity of zooplankton at Pichavaram mangroves, South India. Ad Bios 19: 23-32.
- Murthy AV, Udaya Varma P (1964) The hydrographical features of the waters of Palk Bay during March 1963. J Marine Biol Assoc India 6: 207-216.
- Prabha DL (1986) Hydrobiolgical studies in tidal zone of the Coleroon estuary. Ph.D Thesis, Annamalai University, India.
- Vasantha K (1989) Studies on hydrobiology and decomposition of macrophytes in Porto Novo marine environment (Southeast coast of India), Ph.D., Thesis, Annamalai University, India.
- Chandramohan P, Sreenivas N (1998) Diel variations in zooplankton populations in mangrove ecosystem at Gaderu canal, southeast coast of India. Ind J Mar Sci 27: 486-488.
- Sai Sastry, AG, Chandramohan R (1990) Physicochemical characteristics of Vasishta Godavari estuary, east coast of India: pre pollution status. Ind J Mar Sci 19: 42-46.
- Rajasegar M (2003) Physico-chemical characteristics of the Vellar estuary in relation to shrimp farming. J Environ Biol 24: 95-101.
- Subramanian B, Mahadevan A (1999) Seasonal and diurnal variations of hydrobiological characters of coastal waters of Chennai (Madras) Bay of Bengal. Ind J Mar Sci 28: 429-433.
- Ei-Gindy AH, Dorghan MM (1992) Interrelation of phytoplankton, chlorophyll and Physio-chemical factors in Arabian Gulf and Gulf of Oman during summer. Ind J Mar Sci 21: 257-261.
- Bijoy Nandan S, Abdul Azis PK (1994) Organic matter of sediments from the retting and the non-retting areas of Kadinamkulam estuary, Southeast coast of India. Ind J Mar Sci 25: 25-28.
- Saraswathi R (1993) Hydrobiology of two estuarine systems (Arasalar and Kaveri) of the southeast coast of India with special reference of Plankton, Ph.D., Thesis, Annamalai University, India.
- Vijayakumar SK, Rajesh KM, Mridula R, Mendon, Hariharan V (2000) Seasonal distribution and behaviour of nutrients with reference to tidal rhythm in the Mulki estuary, Southwest coast of India. J Mar Biol Ass India 42: 21-31.
- Mitra A, Patra KC, Panigrahy RC (1990) Seasonal variations of some hydrographical parameters in a tidal creek opening in to the Bay of Bengal. Maha. Bull Nat Inst Oceanogr 23: 55-62.
- Sobsey M, Olison B (1983) Microbial agents of waterborne diseases. Assessment of microbiology and turbidity standards for drinking water. U.S. Environ protec Agency 570: 9-83-001.
- Panigrahi SN, Acharya BC, Das SN (2004) Distribution of diatoms and dinoflagellates in tropical waters of Orissa and West Bengal with emphasis on neritic assemblages. In: Proc Natn. Sem. New Front Mar Biosci Res pp. 535-543.
- Govindasamy C, Kannan L, Jayapaul A (2000) Seasonal variation in physico-chemical properties and primary production in the coastal water biotopes of Coromandel coast, India. J Environ Biol 21: 1-7.
- Choudhury SB, RC Panigrahy (1991) Seasonal distribution and behavior of nutrients in the creek and coastal waters of Gopalpur, east coast of India. Mahasagar. Bull Nat Ins Oceanogr 24: 81-88.
- Segar K, Hariharan V (1989) Seasonal distribution of nitrate, nitrite, ammonia and plankton in effluent discharge area of Mangalore, west coast of India. Ind J Mar Sci 18:170-173.
- Sujatha M, Panda D, Panigrahy RC (1993) Physico-chemical characteristics of the Bahuda estuary (Orissa), east coast of India. Ind J Mar Sci 22: 75-77.
- Subramanyan R, Sarma A (1960) Studies on the phytoplankton of the west coast of India. Part II. Seasonal variations of the phytoplankton and the environmental factors. Ind J Fish 7: 307-336.
- Marichamy R, Gopinathan CP, Pon Sivameetan (1985) Studies on primary and secondary production in relation to hydrography in the inshore waters of Tuticorin. J Mar Biol Ass India 27: 129-137.
- Kawabata Z, Magendran A, Palanichamy S, Venugopalan VK, Tatsukawa R (1993) Phytoplankton biomass and productivity of different size fractions in the Vellar estuarine system, southeast coast of India. Ind J Mar Sci 22: 294-296.
- Gouda R, Panigrahy RC (1995) Seasonal distribution and behavior of nitrate and phosphate in Rushikulya estuary, East coast of India. Ind J Mar Sci 24: 233-235.
Citation: Varadharajan D, Soundarapandian P (2014) Effect of Physico-Chemical Parameters on Species Biodiversity with Special Reference to the Phytoplankton from Muthupettai, South East Coast of India. J Earth Sci Clim Change 5: 200. Doi: 10.4172/2157-7617.1000200
Copyright: © 2014 Varadharajan D, et al. This is an open-access article distributed under the terms of the Creative Commons Attribution License, which permits unrestricted use, distribution, and reproduction in any medium, provided the original author and source are credited.
Share This Article
Open Access Journals
Article Tools
Article Usage
- Total views: 21119
- [From(publication date): 7-2014 - Apr 25, 2024]
- Breakdown by view type
- HTML page views: 16052
- PDF downloads: 5067