Evidences of Manure Driven and C:N Regulated Enhanced Carbon Statusand Microalgal Productivity in Managed Aquatic System under SimulatedGreen House Conditions
Received: 13-Jan-2016 / Accepted Date: 22-Feb-2016 / Published Date: 27-Feb-2016 DOI: 10.4172/2157-7617.1000336
Abstract
The impact of greenhouse gas mediated raised temperature and carbon dioxide on the manure driven carbon status and algal primary productivity was examined in managed aquatic system using six different treatments: (i) cattle manure + saw dust, (ii) poultry dropping + saw dust, (iii) vermi-compost + saw dust (iv) mixed combination with cattle manure, poultry droppings, vermi-compost and saw dust, (v) iso-carbonic states maintained with cattle manure using vermi-compost and (vi) poultry droppings as basal dose maintained under open and simulated greenhouse conditions. There was an opposite responses of the time scale variations of buffering mechanisms between the closed and open conditions. The maximal carbon burial rate, organic carbon but reduced algal productivity in the mixed treatment and the reverse response in the poultry dropping and saw dust combination regulated by the C/N ratio of input manure revealed that the carbon sink in the bottom soil was primarily due to allochthonous origin in the former, and from autochthonous source in the later. It may be concluded that substantial rise in carbon status in the sediment due to greenhouse effect was attributable to enhanced microalgae derived autochthonous carbon sink mediated through integrative functions of temperature induced microalgal productivity and microbial driven manure decomposition. The dead microalgae and residual manure that settled down in the bottom surface enhanced the carbon status of the system, in question.
Keywords: Carbon status; Microalgal productivity; Aquatic system; Polyhouse; Soil-carbon; Simulated green house
Introduction
The climate change is now a scientific reality. The increasing concentrations of greenhouse gases such as carbon dioxide, carbon monoxide, methane and nitrous oxide are the main drivers of the global warming and climate change. The global warming potential of N2O is 310 times more than CO2 over a hundred year life span [1]. In India alone, agriculture sector contributes around 17.6% to the total annual anthropogenic emissions of greenhouse gases [2]. As a result, there has been a widespread international movement in order to reduce the emission of greenhouse gases by adopting several climate resilient mitigation and adaptation strategies.
The processes of biological carbon sequestration in the aquatic system framework involves trapping of atmospheric CO2 through airwater CO2 exchange, sequestration in water column via microalgae and carbon sink in bottom sediments. Biological CO2 fixation has been extensively investigated as part of efforts to solve the global warming problem [3]. As microalgae consume high quantities of CO2 to produce different types of biomass, algae based carbon capture storage technologies are being extensively researched using different strains of microalgae isolated from different habitats [4-6]. The carbon capture potentials of microalgae has been estimated to be about 1.83 kg CO2 per kilogram microalgae [7] and microalgae or pytoplankton support about half of the global primary production [8].
Because of the vast oceanic area, marine phytoplankton has the noble capacity to trap ~50% of the CO2 that is fixed annually worldwide [9] by sequestering more than 100 million tons of carbon dioxide every day [10]. Microalgae are also cultivated commercially for production of biofuels, biodiesel, etc [7]. The advantages of culturing microalgae in inland and marine sources are: (i) no competition of space for agriculture (ii) harvested algae can be converted into different byproducts such as biodiesel, healthy food, animal feedstock, biogas and fertilizer, etc [6,11].
Wetlands are known to have mitigation effects through their ability to sink carbon, and adaptation effects through their ability to store and regulate water [12]. Wetlands, covering 6% of the world’s land surface and 12% of the global carbon pool, play a crucial role in the global cycling of carbon. The wetland soils containing nearly 14.5% of world’s soil carbon are an important source for carbon sink [13,14] and contribute to the regional and global climate [15,16] by storing as high as approximately 44.6 Tg C yr-1 globally [17]. Intensification of functional activity in managed wetlands particularly in aquaculture units has made them more dynamic having regular input of allochthonous matters in the form of fertilizers, manure and feed. A portion of feed lot, manure, and dead plankton settles in the bottom surface in the form of organic matter and eventually become a part of the soil in the long run. The process of humic formation in bottom surface of water bodies is considered a form of accumulation and storage of carbon containing compounds.
The status of carbon sink or sources affects the biodiversity of freshwater ecosystem across most of the Arctic, and the magnitude, extent, and duration of the impacts have been projected to systemand location dependent [18]. It is reported that the global emission of carbon dioxide from inland waters are similar in magnitude to the carbon dioxide uptake by the ocean and that global burial of organic carbon in inland water sediments exceeds organic carbon sequestration on the ocean floor [19]. Thus, inland waters play even a much important role than ocean in terms of carbon sink via active microbial processes of carbon pump that are responsible for transformation of labile dissolved organic carbon into recalcitrant dissolved organic carbon in the bottom sediment [20]. The interplay between dynamic environmental conditions and metabolic responses determine resource allocation and biogeochemical cycling in aquatic system [9].
Aquaculture ponds sequester as much as 0.21% of the annual global C emissions or about 10 Pg/year (1 Pg = Pentagram = billion ton). It is estimated that about 16.6 million tons of carbon is annually buried in aquaculture ponds worldwide [21] of which maximum sequestration occurs in Asia and particularly in China [22]. At the same time, one of the very strong greenhouse gas N2O-N has been projected to increase by 5.72% in 2030 (3.83 × 10¹¹ g) from its estimated emission of 9.30 × 10¹⁰ g in 2009 if the aquaculture industry continues to rise at the current annual growth rate of 7.10% and thereby posing a debate on the issue [1,23]. Nevertheless, the role of aquaculture pond bottom has been greatly emphasized in the global cycling of carbon [24] due to their burial efficiency of organic carbon (buried OC: deposited OC) which was up to 48% (mean) and that was related with the input of allochthonous organic matter in numerous arctic lakes [19,25].
In aquaculture practice, qualitatively different organic manure are used as source of fertilizer for enhancement of fish production via the grazing and detritus food chain that induces organic carbon production through autochthonous and allochthonous sources. Organic matters from dead plankton, organic fertilizers, uneaten feed and excrement of cultured fish sink to the pond bottom and gradually mix with soil particles over time. The small impoundments in farming areas may bury more carbon than the world’s oceans [26,27]. This was due to intensification of farming activity per unit area compared to oceans. However, the role of manure driven carbon status in the framework of aquatic system and its state-of-the-art under greenhouse condition has hardly been researched.
It is hypothesized that greenhouse mediated raised temperature would influence the decomposition of chemically and qualitatively different manure that have immense potentials of carbon sink and bring out changes in the structure and functions of aquatic system through explicitly the involved processes of carbon sequestration such as airwater CO2 exchange, C-sequestration by microalgae and carbon sink in the sediment operating through integrative process of environmental, trophic and microbial activities for carbon pump. The purpose of the present study was to examine the manure driven primary productivity and carbon status in a simulated system under closed and open system within the framework of aquatic environment. The study is pertinent as it envisaged ascertaining the potentials of carbon burial rate of qualitatively different manure mediated through primary production and sink of organic matter as affected by the greenhouse effect.
Materials and Methods
Experimental design
The experiment was performed during winter (December, 2013 through March 2014) using thirty six experimental tanks (300 l) that are placed in equal numbers inside and outside the enclosed polyhouse simulating the green house condition. All the experimental tanks were provided with 18 cm soil at the bottom, filled with aerated ground water (pH 7.2-7.4) and allowed for a week for establishment. The constructed polyhouse with conventional bamboo structure and standard transparent polythene mimicked greenhouse functions.
The experimental tanks, placed inside and outside the enclosed polyhouse, were allotted for six treatments in triplicate. The treatment conditions were: cattle manure (CM) + saw dust (SD) [T1], poultry droppings (PD) + saw dust (SD) [T2], vermi-compost (VC) + saw dust (SD) [T3], mixed combination of cattle manure, poultry droppings, vermi-compost and saw dust [T4], iso-carbonic states maintained with cattle manure using basal manure of vermin compost [T5] and poultry droppings [T6]. Saw dust was a common ingredient of all the six treatments. The rationale of setting up such iso-carbonic state with cattle manure was to examine the role of saw dust as main carbon source while maintaining the low carbon and low nitrogen for vermicompost and low carbon and high nitrogen for poultry dropping, respectively.
Selection of manure
Organic manure such as cattle manure and poultry droppings were selected because of their ease of availability, low costs and common use in agricultural production in India. Cattle manure (C/N = 19; N/P = 3.4) is common manure used for agriculture as well as for aquaculture. It is estimated that the total carbon dioxide emission from cattle manure is 4.7 t CO2/year [28]. Poultry litter (C/N = 9; N/P = 2) is a recognized manure for its high nitrogen content [28]. Nitrous oxide and methane are formed during decomposition as a by-product of nitrification/ denitrification and methanogenesis, respectively. Methane emissions from poultry are 0.57 pounds of methane/animal/year. Vermi-compost (C/N = 17.64; N/P = 1.6) is well known for its eco-friendly nature and balanced nutrients [29]. Carbon dioxide, methane and nitrous oxide emission from vermi-compost unit are 1675, 4.76 and 1.17 mg/m2/hr, respectively. Saw dust (C/N = 511) is wood waste containing a very rich carbonaceous component that are used as a soil amendment especially used to pile up in eco-san toilet to facilitate composting process of human feces [30]. Combustion of saw dust produces 21.3% of CO2 and 60.3% N2 [30]. Saw dust waste can also be degraded by indigenous microbial population of bacteria and fungi [31].
Manuring schedule
Required amount of manure was applied in each treatment in the beginning followed by subsequent application in three installments according to the experimental design (Table 1).
| Conditions | Treatments of manure | |||||
|---|---|---|---|---|---|---|
| T1 | T2 | T3 | T4 | T5 | T6 | |
| Manures | 900 g cow dung + 100g saw dust | 900 g poultry dropping + 100g saw dust | 900 g vermicompost + 100 g saw dust | 300 g cow dung + 300 g poultry dropping +300 g vermicompost +100 g saw dust | 780 g vermicompost + 100 g saw dust | 805 poultry dropping +100 g saw dust |
| Total amount of manure added (g) | 1.0 | 1.0 | 1.0 | 1.0 | 0.9 | 0.39 |
| Total input of carbon (g) | 331.61 | 364.01 | 373.73 | 356.45 | 331.39 | 331.52 |
| Total input of nitrogen (g) | 15.41 | 34.31 | 18.11 | 22.61 | 16.11 | 11.13 |
| C:N ratio | 21.52 | 10.61 | 20.64 | 15.77 | 21.01 | 13.96 |
Table 1: Manuring conditions followed in the experiment.
Collection of data
Samples of surface water of the experimental units were collected from each tank at regular intervals and analyzed for different physicochemical parameters such as temperature, pH, free CO2, carbonate, bicarbonate, hardness, dissolved oxygen following the standard methods (APHA 2005). Samples of surface sediment were collected thrice from each tank prior to the application of manure, seven days after first installment of manure application and at termination after 100 days of experiment. The samples were analyzed for pH, bulk density, particle density, porosity, water holding capacity, organic carbon and carbon burial rate following the standard protocols [32].
Sedimentation rate
Sedimentation rate of organic matter that accumulated in the bottom surface was determined by calculating the weight differences of empty Petri dish before placing them at the bottom of each tank in the beginning and after the end of experiment when the Petri dish was filled with suspended particles. Precaution was taken while removing the Petri dish from the bottom of the tank so that the amount of accumulated particles in the Petri dish was not washed out or removed. The weight differences of the Petri dish gave the sedimentation rate per unit area.
Soil carbon burial rate
The soil carbon burial rate estimated from sediment accumulation rate, dry bulk density, and percentage organic C in sediment following the calculation as follows:
Soil carbon burial rate = Soil sedimentation rate × Soil bulk density ×% of Soil organic carbon
Climatic regime
Ambient air temperature, light intensity and atmospheric CO2 were recorded from within and outside the polyhouse using digital thermometer, LUX meter and CO2 meter (Lutron GCH- 2018), respectively.
Statistical analysis
All the data were statistically evaluated; analysis of variance in the form of split plot model was applied to find the effects of experimental conditions (open and closed), treatments, time and interactions, if any. In this model, individual tanks were considered as whole plot treatment and time as subplot. This was followed by LSD test at 5% level.
Results
Light intensity and temperature
The mean intensity of light inside the polyhouse was attenuated by 200% with the values ranging from 145 to 340 LUX against 198 to 580 LUX in the open air system. The air temperature has been increased inside the polyhouse (34-44°C) compared to open air system (25- 35°C) as a result of emission of greenhouse gases. The overall mean air temperature was 39°C and 29.5°C, in the closed polyhouse and open system, respectively.
The magnitude of temperature difference was less in water (5.23°C) than in air (9.5°C). Clearly, differences in thermal regime of water were responsible for microbial induced manure decomposition and subsequently productivity of microalgae and their potentials to sequester carbon in the system.
Air carbon dioxide
There has been significant rise in the concentrations (70%) of atmospheric carbon dioxide inside the polyhouse (490-905 ppm) compared to open air system (370 -440 ppm). The mean concentration of air carbon dioxide was 698 ppm in the enclosed polyhouse and 405 ppm in open air, respectively. The elevated mean atmospheric carbon dioxide inside the polyhouse affected the carbon dioxide level of water through absorption and brought out changes in buffering capacity of water as well as carbon sequestration potentials of photosynthesis of microalgae.
Primary productivity of microalgae
The primary productivity of phytoplankton experienced around 10-fold variations ranging from 32.33 mg/cm2/hr to 307.88 mg/ cm2/hr in different treatments employed. Application of poultry droppings mixed with saw dust (T-2) resulted in highest gross primary productivity (GPP) (Figure 1), net primary productivity (NPP) (Figure 1) and community respiration (CR) of phytoplankton (Figure 1), and lowest in the treatment (T-4) with mixed manure (F5, 35 ≥ 24.46; P < 0.001). LSD test revealed that three treatment groups were clearly recognized: highest in T-2, second in T- 3 and T-4 and the lowest in the group comprising T-1, T- 4 and T-6 (Figure 1).
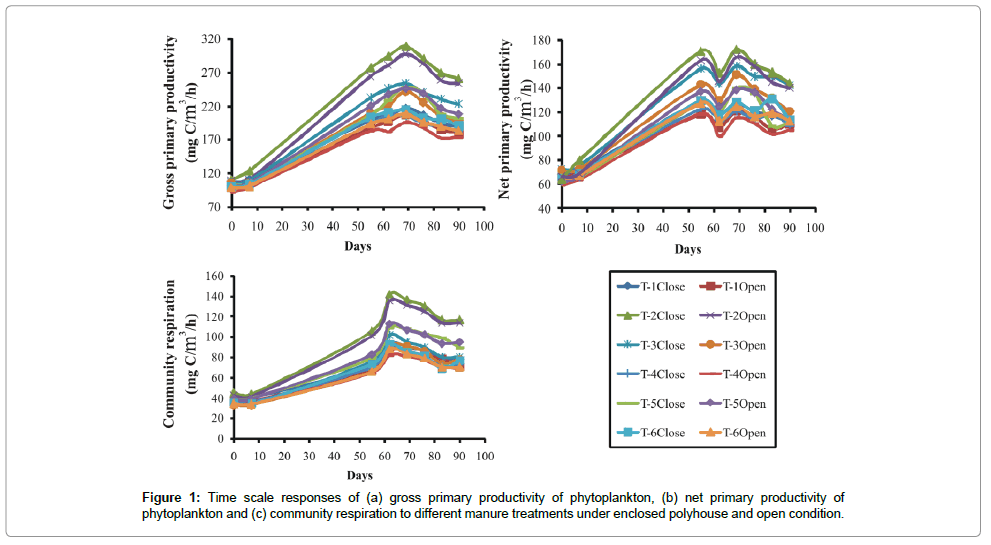
Figure 1: Time scale responses of (a) gross primary productivity of phytoplankton, (b) net primary productivity of phytoplankton and (c) community respiration to different manure treatments under enclosed polyhouse and open condition.
Frequency distribution of gross primary productivity of phytoplankton (Figure 2), NPP (Figure 3) and CR (Figure 4) showed the occurrence of highest values in T-2 (poultry droppings and saw dust) as evident from more occurrence of higher class (250-279.99 mg/ cm2/hr). Whereas such higher class range was absent in the remaining treatments (Figure 5). As a result, this group was significantly different (P < 0.05) from the next lower group (T-3 and T-4). The third group comprising T-1, T-4 and T-6 (Figure 5) that remained significantly different (P<0.05) from the rest two groups was characterized by the absence of productivity class range of 130.00-159.99 mg/cm2/hr. Responses of net primary productivity of microalgae and community respiration followed the trend similar to that of gross primary productivity.
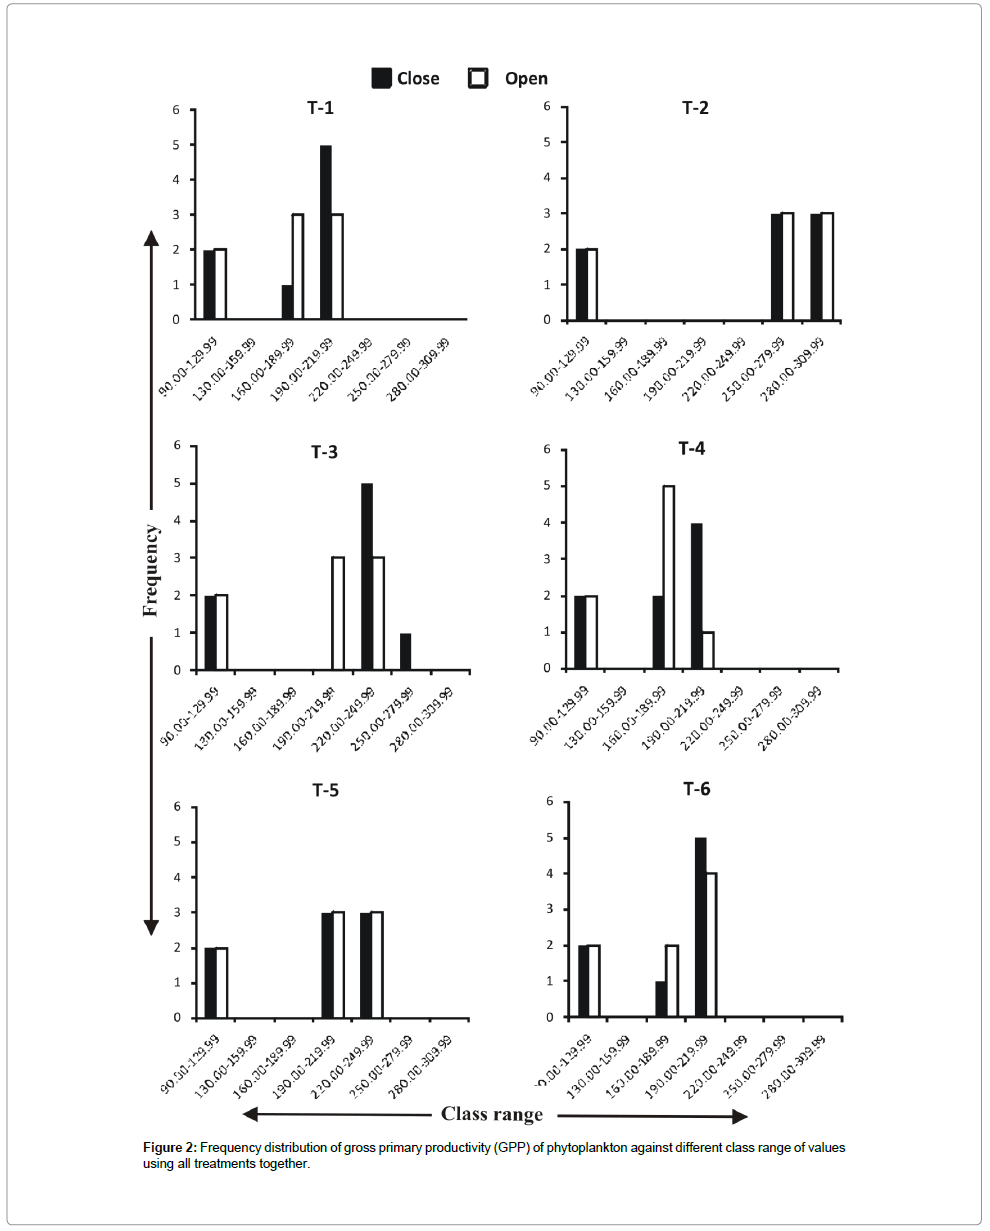
Figure 2: Frequency distribution of gross primary productivity (GPP) of phytoplankton against different class range of values using all treatments together.
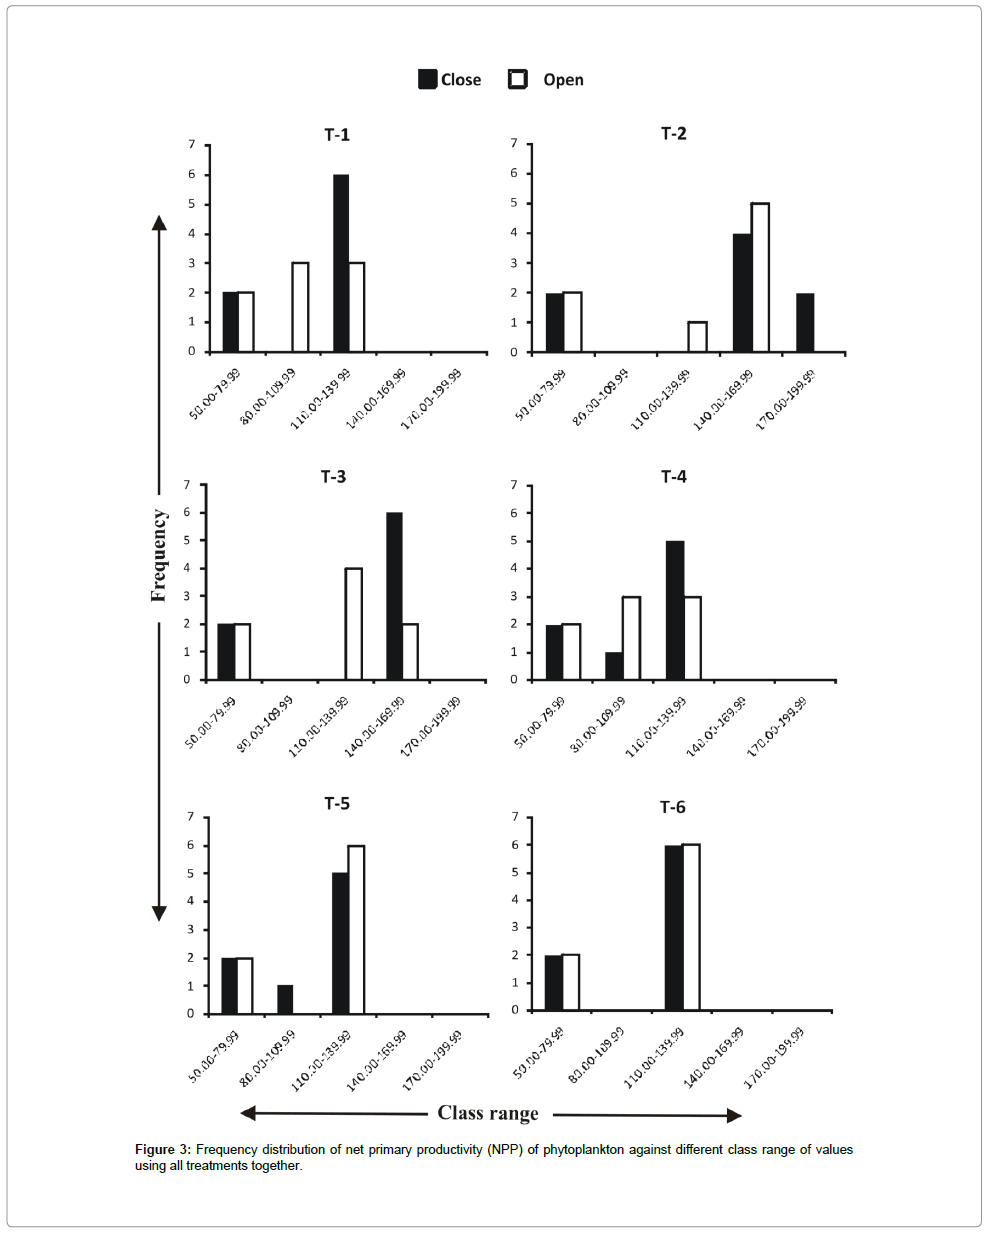
Figure 3: Frequency distribution of net primary productivity (NPP) of phytoplankton against different class range of values using all treatments together.
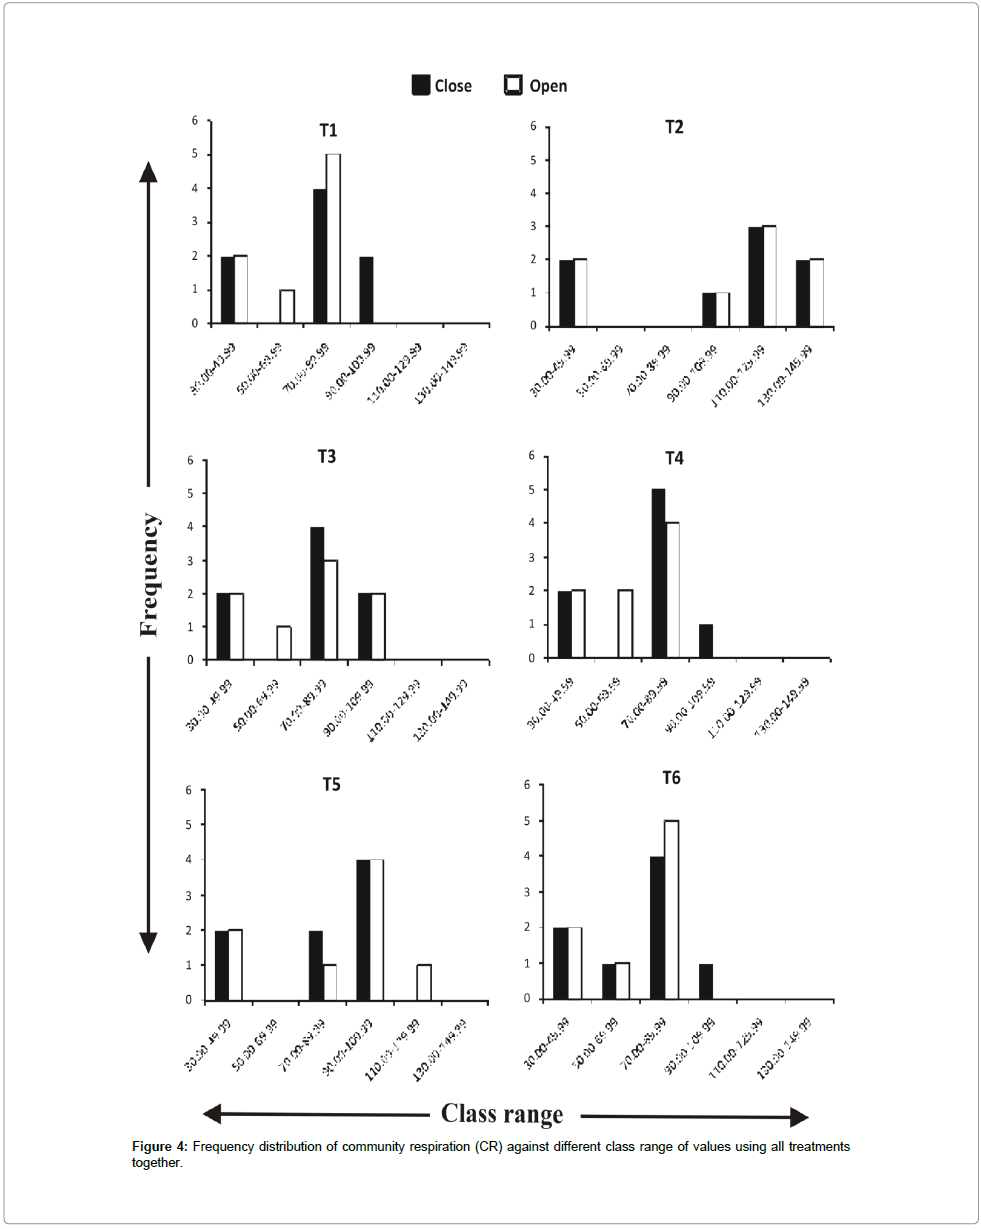
Figure 4: Frequency distribution of community respiration (CR) against different class range of values using all treatments together.
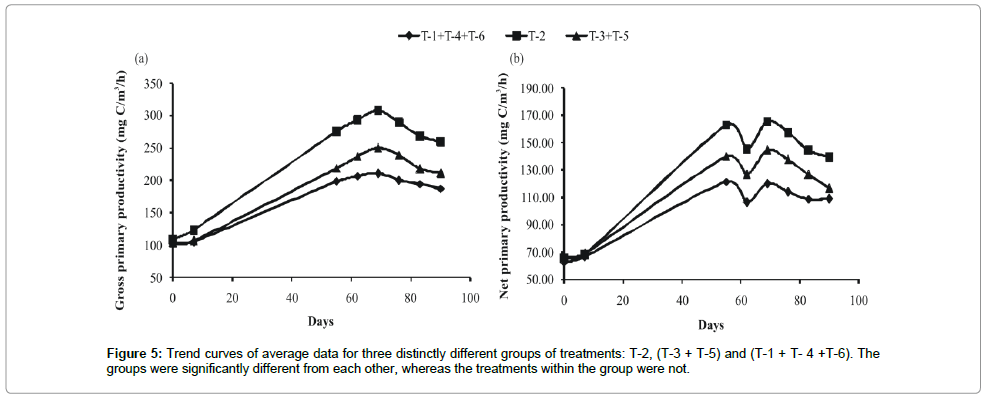
Figure 5: Trend curves of average data for three distinctly different groups of treatments: T-2, (T-3 + T-5) and (T-1 + T- 4 +T-6). The groups were significantly different from each other, whereas the treatments within the group were not.
Temporal courses of variations of GPP experienced almost a sigmoid curve in three groups of treatments. There was no difference in the values of GPP among the treatments during the initial lag phase, but the changes were well marked during the next logarithmic phase (Figure 1). Though there was no strong impact of green house (polyhouse) mediated raised temperature on specific treatment, the mean value for all treatments under simulated greenhouse condition remained significantly higher (P<0.05) than outside treatments. This shows that GHG emitted raised temperature was responsible for induction of manure driven primary production via microbial decomposition of manure and phytoplankton derived carbon sink in T-2.
Carbon burial rate
Carbon burial rate was less variable (3.57 fold) under simulated greenhouse condition ranging from 33.46 g/m2 to 118.03 g/m2 per 100 days compared to open system (23.81 g/m2 to 102.94 g/m2 per 100 days) in all treatments. Hence, the overall mean for different treatments attributable to greenhouse effects was 27% higher than under open conditions (Figure 6).
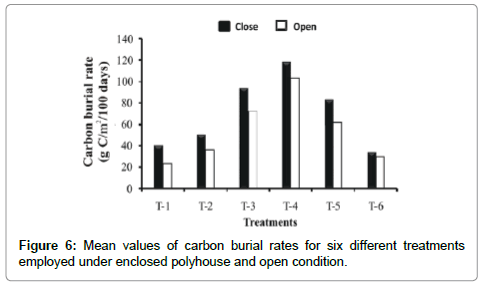
Figure 6: Mean values of carbon burial rates for six different treatments employed under enclosed polyhouse and open condition.
Treatment-wise, application of mixed manure (T-4) resulted in highest carbon burial rate among all the treatments under both the conditions examined. Reduced rates of carbon burial in cattle manure (T-1), poultry droppings (T-2) and iso-carbonic state with poultry dropping (T-6) implied that these treatments were less effective as a depository of carbon due to fast turnover of carbon in the cattle dung manure through biogeochemical cycling of decomposition and mineralization. However, the rate of increase was significantly higher in all treatments under closed system than in open ones (Figure 6) implying that increase of carbon sink was explicitly GHG dependent.
Water and soil environment
The pH-free CO2-CO3--HCO3-system: Responses of pH to treatments were quite different between the enclosed and outside polyhouse. Fluctuations of water pH were more wide (7.87-8.09) inside the polyhouse compared to outside (8.47-8.80). Prevalence of more acidic condition of water inside the polyhouse than outside (P<0.05) was due to rapid rate of microbial decomposition of manure in the former caused by polyhouse mediated raised temperature (Table 2). The carbon dioxide- carbonate-bicarbonate systems also differed (ANOVA; P<0.001) between the two conditions employed. The concentrations of bicarbonate, total alkalinity and hardness of water were significantly higher (P<0.05) in the treatment with poultry dropping and saw dust (T-2) under closed system, whereas lower values were registered in the treatment with cattle manure and saw dust (T-1) under any condition either. This suggests that saw dust and poultry dropping combination caused alkaline state with more calcium carbonate and concomitant increase in the concentration of total alkalinity of water.
| Parameters | T-1 | T-2 | T-3 | T-4 | T-5 | T-6 | ||||||
|---|---|---|---|---|---|---|---|---|---|---|---|---|
| Range | Mean ± SE | Range | Mean ± SE | Range | Mean ± SE | Range | Mean ± SE | Range | Mean ± SE | Range | Mean ± SE | |
| Close | ||||||||||||
| pH | 7.4-8.2 | 7.7-8.2 | 7.8-8.2 | 7.7-8.2 | 7.9-8.2 | 7.8-8.3 | ||||||
| Free CO2 (mg/l) | 0-16 | 5.375 ± 0.93 | 0-20 | 6.25 ± 1.09 | 0-16 | 4.75 ± 0.83 | 0-18 | 6.38 ± 1.10 | 0-24 | 7.5 ± 1.30 | 0-30 | 7.75 ± 1.39 |
| Carbonate (mg/l) | 0-24 | 5.63 ± 0.91 | 0-28 | 8.31 ± 1.14 | 0-20 | 6 ± 0.80 | 0-18 | 4.88 ± 0.71 | 0-20 | 5.69 ± 0.82 | 0-18 | 6.06 ± 0.77 |
| Bicarbonate (mg/l) | 24-294 | 132.31 ± 14.98 | 26-370 | 169.19 ± 19.47 | 16-312 | 149 ± 17.35 | 16-260 | 132.63 ± 15.02 | 18-290 | 150.75 ± 16.91 | 18-320 | 148.75 ± 17.13 |
| Alkalinity (mg/l) | 28-318 | 137.94 ± 15.16 | 42-398 | 177.5 ± 19.48 | 23-330 | 155 ± 17.28 | 20-276 | 137.5 ± 14.99 | 23-301 | 156.44 ± 16.84 | 26-338 | 154.81 ± 17.04 |
| Hardness (mg/l) | 224-328 | 271.25 ± 4.35 | 260-428 | 346.625 ± 7.73 | 268-404 | 325.81 ± 4.90 | 244-372 | 303.25 ± 5.34 | 224-328 | 284.5 ± 4.46 | 248-356 | 307.5 ± 4.16 |
| TDS (mg/l) | 298-565 | 488.125 | 420-912 | 691.1875 | 325-605 | 531.0625 | 320-700 | 678.5 | 278-588 | 486.75 | 322-645 | 540.875 |
| Conductivity (μS/cm) | 590-755 | 673.38 | 570-1260 | 954.875 | 853-589 | 750.9375 | 610-990 | 801.9375 | 575-774 | 679.75 | 600-896 | 758.375 |
| DO (mg/l) | 6-8.9 | 8.16 ± 0.12 | 0.8-6 | 2.28 ± 0.28 | 6.8-8.2 | 8.15 ± 0.03 | 6.9-7.9 | 7.52 ± 0.04 | 6.8-8.1 | 7.77 ± 0.04 | 6.8-9 | 7.95 ± 0.08 |
| Open | ||||||||||||
| pH | 8.3-8.8 | 8.3-9.2 | 8.3-8.8 | 8.5-9 | 8.3-8.8 | 8.3-8.8 | ||||||
| Free CO2 (mg/l) | 0 | 0 | 0 | 0 | 0 | 0 | 0 | 0 | 0 | 0 | 0 | 0 |
| Carbonate (mg/l) | 3- 22 | 9.3125 ± 0.74 | 6- 24 | 11.56 ± 0.65 | 4- 18 | 9.8125 ± 0.59 | 4- 16 | 9.8125 ± 0.54 | 5-20 | 11.06 ± 0.74 | 6- 20 | 11.50 ± 0.62 |
| Bicarbonate (mg/l) | 24-289 | 150.62 ± 16.59 | 18-322 | 168.31 ± 18.2 | 28-305 | 164.56 ± 17.8 | 28-308 | 162.69 ± 17.45 | 22-295 | 147.5 ± 16.28 | 22-310 | 161.375 ± 18.2 |
| Alkalinity (mg/l) | 27-311 | 159.94 ± 17.23 | 24-346 | 179.88 ± 18.7 | 34-323 | 174.38 ± 18.3 | 32-322 | 172.5 ± 17.95 | 27-311 | 158.56 ± 16.91 | 28-324 | 172.88 ± 18.84 |
| Hardness (mg/l) | 240-364 | 296 ± 4.82 | 220-392 | 311.5 ± 6.58 | 216-344 | 275.75 ± 3.99 | 240-324 | 289.5 ± 3.46 | 260-332 | 305.125 ± 3.02 | 246-340 | 291.94 ± 3.96 |
| TDS (mg/l) | 260-570 | 479.3125 | 259-633 | 552.6875 | 240-510 | 430.9375 | 246-512 | 447.9375 | 280-590 | 498.75 | 257-558 | 493.8125 |
| Conductivity (μS/cm) | 575-760 | 665.8125 | 570-890 | 753.0625 | 535-686 | 617.375 | 560-723 | 647.0625 | 577-840 | 713.0625 | 584-786 | 695.125 |
| DO (mg/l) | 8-10.1 | 9.32 ± 0.08 | 1.1-8.1 | 3.71 ± 0.32 | 7.4-10.4 | 9.38 ± 0.12 | 7.7-10.5 | 9.39 ± 0.11 | 7.9-10.7 | 9.53 ± 0.12 | 7.6-11.1 | 9.64 ± 0.14 |
Table 2: Range and mean (S.E.) of water quality parameters in different treatments under enclosed polyhouse and open conditions.
Total dissolved solids (TDS) and specific conductance: Application of poultry dropping and saw dust (T-2) resulted in significantly higher (P<0.05) amount of total dissolved solids (691.19 mg/l) and specific conductivity of water (954.88 μS/cm) compared to other treatments (TDS: 541.81- 486.75 mg/l; Specific conductance: 801.94-673.38 μS/cm) showing almost similar responses among themselves.
GHG mediated raised temperature in T-2 caused 25 or 27% rise in the values of TDS (691.19 mg/l) and Specific conductance (954.88 μS/cm) compared to open system (TDS -552.69 mg/l; SC-753.06 μS/ cm) As expected, specific conductivity measuring the ionic content of a solution was highly related with the TDS reflecting the biological productivity of the system in question.
Dissolved oxygen (DO): The concentration of dissolved oxygen of water ranged from the minimum of 0.8 mg/l to the maximum of 10.9 mg/l in all the treatments during the course of investigation. Lowest values of dissolved oxygen in the poultry dropping and saw dust combination (T-2) reflected the maximum decomposition potential of this combination under both closed and open system.
Soil pH: Application of manure resulted in relatively reduced pH of soil with values ranging from 7.1-7.6 in open conditions against 6.9-7.6 in closed systems. Green house mediated enhanced microbial decomposition was responsible for the more acidic conditions which occurred in more than 84% of the total number of observations (Table 3).
| Parameters | Close | Open | ||||||||||
|---|---|---|---|---|---|---|---|---|---|---|---|---|
| T-1 | T-2 | T-3 | T-4 | T-5 | T-6 | T-1 | T-2 | T-3 | T-4 | T-5 | T-6 | |
| Soil pH | 6.9-7.1 | 7.3-7.4 | 7.3-7.6 | 6.9-7.1 | 7.1-7.3 | 7.1-7.2 | 7.1-7.3 | 7.2-7.5 | 7.2-7.4 | 7.2-7.4 | 7.3-7.6 | 7.4-7.6 |
| Water holding capacity (%) | 90.699 | 71.543 | 74.651 | 71.893 | 70.546 | 80.494 | 86.978 | 75.436 | 73.737 | 72.906 | 74.387 | 81.441 |
| Soil sedimentation rate (cm/100days) | 0.500 | 0.500 | 0.800 | 0.800 | 0.700 | 0.400 | 0.400 | 0.400 | 0.700 | 0.800 | 0.600 | 0.400 |
| Bulk density (gm/cm3) | 0.639 | 0.747 | 0.771 | 0.847 | 0.826 | 0.742 | 0.640 | 0.732 | 0.757 | 0.833 | 0.797 | 0.730 |
| Total porosity (%) | 57.921 | 53.416 | 57.522 | 60.871 | 58.240 | 59.715 | 55.649 | 55.210 | 55.848 | 60.711 | 59.276 | 59.475 |
| Particle density (gm/cm3) | 1.518 | 1.603 | 1.814 | 2.164 | 1.977 | 1.841 | 1.802 | 1.443 | 1.634 | 1.715 | 2.120 | 1.957 |
| Organic carbon (mgC/gm) | 25.987 | 29.287 | 31.073 | 38.653 | 33.700 | 27.640 | 23.847 | 27.673 | 29.787 | 31.360 | 28.100 | 26.333 |
Table 3: Range and mean (± SE) of soil quality parameters analyzed in different treatments under enclosed polyhouse and open conditions.
Soil sedimentation rate: There was no difference in the rate of sedimentation ranging from 0.4 cm to 0.8 cm/100 days in different treatments employed under closed and open systems. The highest rate was observed in mixed treatment (T 4) both in closed and open systems. This was followed by vermi compost and saw dust (T-3) treatment showing the next higher values.
Organic carbon (OC): The organic carbon content of soil ranged from 11.52 mg C/g to 55.1 mg C/g and 16.08 mg C/g to 48.2 mg C/g in the treatments under closed and open system, respectively. The values were significantly higher (P<0.01) in all treatments under enclosed polyhouse than outside. Treatment-wise, mixed manure (T-4) and iso-carbonic state with poultry dropping (T-6) showed the highest and lowest values, respectively (Table 3). On a temporal scale, increase in the concentration of organic carbon was registered over the passage of time regardless of treatments either in closed or open conditions. However, the rate of increase was found to be much higher under green house condition than outside. The variations of organic carbon content of accumulated sediment were almost similar to that of treatment related organic carbon of soil, being maximal in T-4 followed by T-3.
Discussion
Since the primary productivity of phytoplankton and soil carbon status have been significantly increased in all the tanks regardless of treatment under simulated greenhouse conditions than outside, it is apparent that increased carbon status related with carbon burial rate in the former was the result of manure driven algal productivity and rapid microbial decomposition and subsequent mineralization through biogeochemical cycling bacteria.
Algae inhabit a dynamic photic zone that changes both in quantity and quality of light and posses adaptive mechanisms with high degree of diversity in the photosynthetic apparatus to maximize light harvesting and to limit damage by excessive amount of photosynthetically active radiation and UV radiation in the environment. The green house mediated raised temperature (5.23°C) consequent upon the elevated atmospheric levels of CO2 (490-905 ppm) under the enclosed polyhouse was responsible for the enhancement of primary productivity of phytoplankton mediated through dissolution of atmospheric CO2 into water as well as availability of adequate nutrients released from autochthonous and allochthonous sources. Alternatively, this was explained as a result of prevalence of conducive range of both high temperature (34-44°C) and low light intensity (145 to 340 LUX) for the growth of microalgae or reduced photosynthetic performance of microalgae outside due to the effects of high light intensity (198 to 580 LUX) and low temperature (25-35°C). The effect of elevated levels of CO2 on the photosynthetic performance of microalgae is well understood [33]. The role of light on the photosynthetic efficiency of phytoplankton has been tested by developing an exponential equation model to describe photosynthetic rate of phytoplankton as a function of light intensity for a variety of unicellular microalgae and higher plants where photosynthesis is proportional to (1 = e –β 1). The parameter β (= Ik-1) is derived by simultaneous curve fitting method where I is incident quantum-flux density [34]. Chen [35] demonstrated that the optimal, minimal and maximal growth temperatures of phytoplankton decrease with latitude for marine taxa, whereas the minimal and maximal growth temperatures are relatively invariant with latitude for freshwater phytoplankton. Further the thermal breadth is larger for freshwater than marine phytoplankton. Using a mechanistic approach, Huertas et al. [8] provided evidence for different degrees of tolerance to temperature rises as well as an interspecific capacity for genetic adaptation. It is, therefore, reasonable to assume that the enhancement of carbon status in the tank sediment of all treatments under simulated greenhouse conditions was due to greenhouse effect. Using polyhouse experiment in fish ponds, Jana et al. [36] concluded that the benefit of closed polyhouse may be profitably used by the farmers for inducing breeding in tilapia and growth enhancement in other Indian fish during winter months and other region of the country in general.
The ideal C/N ratio for composting is generally considered to be around 30:1 under terrestrial condition [37], whereas it was 11.8:1 for microbial decomposition of fertilizer in aquatic system [38]. About two fold variations of the C/N ratio of different input manure combinations (10.61 to 21.52) used in study reflected their potentials to sequester or source of carbon through microalgal dominated autotrophic or bacterial dominated heterotrophic metabolism in the framework of aquatic system. Accumulated organic matter reflecting organic carbon in the sediment is mineralized to CO2 or CH4 by heterotrophic microbes or it is gradually mixed with soil particles or buried in the sediment over time scale. Microbial carbon pump was found to exert a profound role in the transformation of labile organic carbon into recalcitrant organic carbon in the soil [20]. In aquaculture ponds, a layer of sediment with higher concentration of organic carbon of pond soil developed a characteristic profile of well defined strata or horizons [39].
The organic carbon content of soil ranging from 29.58-118.02 ppm was highly correlated (r = 0.82; P < 0.001) with the carbon burial rates which varied by a factor of 5 in different treatments employed. Further, the green house effects were clearly manifested in the study because of distinctly higher values of soil organic carbon in all treatment tanks inside than outside.
The primary productivity of microalgae was found to be substantially higher within the range of 25 and 40 mg/g of organic carbon of soil in the overall range of 11.52 and 55.1 mg in all treatments. This suggests that this range of organic carbon was conducive to microalgae production regardless of the condition employed. Further, the highest algal productivity accompanied by attenuated carbon burial rate (118.026 g /m2/100 day) in poultry dropping and saw dust (T-2) treatment combination and the reverse response in the mixed treatment (cattle manure, poultry dropping, vermi-compost and saw dust combination), implied that high manural value of the former which was due to the blend of extremely high C/N ratio of saw dust (100-500) and low C/N ratio of poultry dropping (<10). This shows that the saw dust- almost a discarded material, can be effectively used as manure in aquaculture system in combination with poultry dropping even though the saw dust is rich in carbonaceous substances having very high C/N ratio (fresh-saw dust-200, decomposed saw dust-500). However, it is reported that there was no increase in soil organic matter and soil total carbon due to application of saw dust in agricultural corn field [40].
Substantial decline in carbon burial rate and organic carbon of soil in poultry dropping and saw dust combination was attributed to enhanced manure decomposition due to reduced carbon relative to nitrogen (C/N = 10.61), mineralization and subsequent utilization by microalgal biomass through biogeochemical cycling rather than its sink as residual organic carbon in sediment which was encountered in the mixed treatment (T-4) showing the reverse response with T-2 where nitrogen is more relative to carbon (C/N = 15.77). So, the overall soil carbon status in the former was primarily regulated by CN ratio driven autochthothonous source derived from dead massive algal bloom and less by the allochthonous source of residual manure and vice versa in the later where heterotrophic metabolism and carbon sink dominated by the integrative environmental, trophic and microbial carbon pump. The lowest carbon burial rate in iso-carbonic state (T-6) using reduced load of poultry dropping and saw dust indicated that the carbon sequestrating capacity of the bottom soil was to some extent input load dependent even with low CN ratio (13.96).
Autochthonous DOC accounted for >25% of the total water column DOC pool, and autochthonous OC production attenuated the concentration of dissolved inorganic carbon in the water column and thereby contributing to atmospheric carbon dioxide uptake [41]. It is known that sediment metabolism is dependent upon the allochthonous carbon source [42], and much of the organic matter of autochthonous origin derived from dead plankton, fish excrement, etc. is readily decomposed, mineralized and utilized for ecosystem functioning. Lakes are grouped into lakes with net consumption of CO2 in the sediment with <5.6 mg/l dissolved organic carbon and lakes with very low dissolved organic carbon (<2.6 mg/l) which were net autotrophic due to dominance of allochthonous organic matter in the water as an energy source for aquatic organism [42]. Diverse soil organic compounds exhibit a wide range of kinetic properties that determine the intrinsic temperature sensitivity of decomposition of specific organic compounds [43] and, hence, have potentials of positive or negative feedback effects on climate.
Experimental evidences suggest that the green house mediated raised temperature primarily coupled with elevated CO2 absorbed through diffusion in the aquatic phase and brought out changes in the time scale variations of buffering mechanisms showing opposite responses under the closed and open conditions. High temperature induced rapid microbial decomposition under closed condition resulted in gradual development of alkaline condition from its initial acidic mode with high concentrations of free carbon dioxide that, in turn, brought associated changes of water and sediment quality as well as primary productivity of microalgae over the course of time. Exhibiting a strong direct relationship with each other, the pattern of changes of TDS and specific conductance of water remained distinctly higher under simulated greenhouse conditions than open system.
Carbon sequestration capacity of aquaculture ponds could be used as carbon reduction credits against carbon emissions from aquaculture production. Net carbon sequestration (carbon emissionscarbon sequestration) by aquaculture operations could be treated as carbon credits. It is further revealed that the green house effects in the framework of managed aquatic environment were profound because of elevated carbon burial rate under the closed condition than outside. The carbon burial rate in different lakes, aquaculture ponds and reservoirs was highly variable ranging from 0.05 -21.2 t/ha/yr [21]. In a subtropical eutrophic Donghu lake, the carbon sink was estimated to be great with C input as 14905 t and C output as 4950 t and net carbon budget as 9955 t [44]. Further, it is suggested that increasing soil organic carbon (SOC) pool in soils could offset emissions of CO2 from fossil fuel combustion [21].
As a mechanistic model, it is proposed that substantial rise in carbon sink due to greenhouse effect in the framework of managed aquatic system is attributable to microalgae derived autochthonous carbon sink mediated through integrative functions of raised temperature, carbon dioxide level and manure-microbial driven nutrient release conducive to sequester autochthonous carbon via photosynthesis of microalgae, and the allochthonous carbon sink in heterotrophic dominated framework was mediated through microbial carbon pump that transform labile carbon into immobile or depository carbon in the soil. It is projected that under future global warming scenarios partitioning of primary production into DOC could be enhanced and thus MCP could play an even more important role in carbon sequestration [20].
Conclusion
It may be concluded that substantial rise in carbon status in the sediment due to green house effect was attributable to enhanced microalgae derived autochthonous carbon sink mediated through integrative functions of temperature induced microalgal productivity and microbial driven manure decomposition. The dead microalgae and residual manure that settled down in the bottom surface enhanced the carbon status of the system, in question.
Acknowledgement
This research was component of the ICAR NICRA Project sponsored by the Indian Council of Agricultural Research (to BBJ), New Delhi. We thank Mr. Prodyut Ghosh and Miss Debarati Ghosh and Miss Ankita Bhattacharyya for their help during the preparation of the manuscript.
References
- Hu Z, Lee JW, Chandran K, Kim S, Khandal SK (2012) Nitrous oxide (N2O) emission from aquaculture: A review. Environ Sci Technol 46: 6470-6480.
- Indian Network for Climate Change Assessment (2010) India: Greenhouse gas emissions 2007. Ministry of Environment and Forests. Government of India, New Delhi.
- Chisti Y (2007) Biodisel from microalgae. Biotechnolgy Advances 25: 294-306.
- Sydney EB, Sturm W, Larroche C (2010) Potential carbon dioxide fixation by industrially important microalgae. Bioresource Technology 101: 5892-5896.
- Ho SH, Chen CY, Lee DJ, Chang JS (2011) Perspectives on microalgal CO2 emission mitigation systems: a review. Biotechnology Advances 29:189-198.
- Lancu P, Plesu V, Velea S (2012) Flue gas CO2 capture by microalgae in photobioreactor: a sustainable technology. Chemical Engineering Transactions 29: 799-804.
- Brennan L, Owende P (2009) Biofuels from microalgae: A review of technologies for production, processing, and extraction of biofuels and co-products. Renewable and Sustainable Energy Reviews.
- Huertas E, Rouco M, Lopez-Rodas V, Costas E (2011) Warming will affect phytoplankton differently: evidence through a mechanistic approach. Proceedings B, The Royal Society 282: 3534-3543.
- Toseland A, Daines SJ, Clark JR, Kirkham A, Strauss J, et al. (2013) The impact of temperature on marine phytoplankton resource allocation and metabolism. Nature Climate Change 3: 979-984.
- Behrenfeld MO, Malley R, Siegel D, McClain C, Samiento J, et al. (2006) Climate driven trends in contemporary ocean productivity. Nature 444: 752-755.
- De la Rubia MA, Walker M, Heaven S, Banks CJ, Borja R (2010) Preliminary trials of in situ ammonia stripping from source segregated domestic food waste digestate using biogas: effect of temperature and flow rate. Bioresource Technology 101: 9486-9492.
- US EPA (2009) Synthesis of adaptation options for coastal areas, Washington DC. US. Environmental Protection Agency, Climate Ready Estuaries Programme. EPA 430-F-08-024.
- Ferretti DF, Miller JB, White JWC, EtheriddgeDM, Lassey KR, et al. (2005)Unexpected Changes to the Global Methane Budget over the Past 2000 Years. Science 309: 1714-1717.
- IPCC (2014) Climate change -2014: impacts, adaptation, and vulnerability: Part-B: Regional Aspects. Cambridge University Press.
- Cole JJ, Prairie YT, CaracoNF, McDowell WH, TranvikLJ, et al. (2007) Plumbing the global carbon cycle: integrating inland waters into the terrestrial carbon budget. Ecosystems 10:171-184.
- Sobek S, Tranvik LJ, Prairil YT, Kortelainen P, Cole JJ (2007) Patterns and regulation of dissolved organic carbon: An analysis of 7500 widely distributed lakes. Limnology &Oceanogr52: 1208-1219.
- Chmura GL, Anisfeld SC, Cahoon DR, Lynch JC (2003) Global carbon sequestration in tidal, saline wetland soils. Global Biogeochemical Cycles 17: 1111.
- Wrona FJ, Prowse TD, Reist JD, Hobbie JE, Levesque LMJ, et al.(2006) Climate change effects on biota, ecosystem structure and function. Ambio35: 359-369.
- Tranvik LJ, Downing JA, Cotner JB,Loiselle SA, Striegl RG, et al. (2009)Lakes and reservoirs as regulators of carbon cycling and climate. Limnolgy& Oceanography54: 2298-2314.
- Jiao N, Zheng Q (2011)The microbial carbon pump: from genes to ecosystems. Applied Environmental Microbiol77: 7439-7444.
- Boyd CE, Wood WW, Chaney PL, Queiroz JF (2010) Role of aquaculture pond sediments in sequestration of annual global carbon emissions. Environmental Pollution 158: 2537-2540
- Verdegem MC, Bosma RH (2009) Water withdrawal for brackish and inland aquaculture, and opinions to produce more fish in ponds with present water use.Water Policy11: 52-68.
- Zheng J (2010) Temperature sensitivity of soil organic matter decomposition and the influence of soil carbon pools and attributes. Iowa State University, USA.
- Dean WF, Gorham E (1998) Magnitude and significance of carbon burial in lakes, reservoirs and peatlands. Geology 26: 535-538.
- Sobek S, Anderson NJ, Bernasconi SM, Del Sontro T (2014) Low carbon burial efficiency in arctic lake sediments. Journal of Geophysical Research: Biogeosciences, 119: 1231-1243.
- Downing JA, Prairie YT, Cole JJ, Durante CM,TranvikLJ,et al. (2006) The global distribution of lakes, ponds, and impoundments. Limnology and Oceanography 51: 2388-2397.
- Downing JA, Cole JJ, Middelburg JJ, Striegl R, Durante CM, et al. (2008) Sediment organic carbon burial in agriculturally eutrophic impoundments over the last century. Global Biogeochemical Cycles 22: 1-10.
- Food and Agriculture Organization of the United Nations (FAO) (2007) Fisheries Technical Paper 366. Aquaculture Feed and Fertilizer Resource Atlas of the Philippines.
- MistryJ, Mukhopadhyay AP, Baur GN (2015) Status of NPK in vermicompost prepared by two common weed and two medicinal plants. Journal of Advanced Studies in Agricultural Biological and Environmental Sciences 2: 25-38.
- Jenkins J (2005) The Carbon/Nitrogen Ratio. The Humanure Handbook. (3rd Ed) Chelsea Green Publishing: Grove City, USA
- Eze VC, Uzoaru N, Agwung-Fobella D (2011) Isolation and characterization of microorganisms involved in degradation of saw dust waste in rivers state, Nigeria. Asian Journal of Science and Technology 1: 44-48.
- Jackson ML (1967) Soil Chemical Analysis. Prentice Hall of India, New Delhi.
- Peterson DH, Perry MJ, Bencala KE, Talbot MC (1987)Phytoplankton productivity in relation to light intensity: A simple equation. Estuarine, Coastal and Shelf Science 24: 813-832.
- Chen B (2015) Patterns of thermal limits of phytoplankton. J Plankton Res.
- Jana BB, Lahiri S, Nandy S, Ghosh P, Bag SK, et al. (2015) Polyhouse driven raised temperature induces cichlid tilapia to breed during winter. Indian Journal of Animal Science 85: 108-115.
- Dickson N, Richard T, Kozlowski R (1991) Composting to reduce the waste stream. Cornell Composting-Science and Engineering, Cornell University, Ithaca, USA.
- JanaBB, Chakraborty P, Biswas JK, Ganguly S(2001) Biogeochemical cycling bacteria as indices of pond fertilization: importance of CNP ratios of input fertilizers. J Applied Microbiology 90: 733-740.
- Munsiri P, Boyd CE, Hajek BF (1995) Physical and chemical characteristics of bottom soil profiles in ponds at Auburn, Alabama, USA, and a proposed method for describing pond soil horizons. Journal of the World Aquaculture Society 26: 346-377.
- Tran HM (2005) Quantifying the effects of saw dust application and soil chemical and physical properties and corn yield. University of Tennessee.
- Watanabe K, Tomohiro K (2015)How organic carbon derived from multiple sources contributes to carbon sequestration processes in a shallow coastal system? Global Changes Biology21: 2612-2623.
- Algesten G, Sobek S, Bergstrom AK, Jonsson A, Tranvik, LJ, et al. (2005)Contribution of Sediment Respiration to Summer CO2 Emission from Low Productive Boreal and Subarctic Lakes Microbial Ecology 50: 529-535.
- Davidson EA, Jenssen IA (2006) Temperature sensitivity of soil carbon decomposition and feedbacks to climate change. Nature 440: 165-173.
- Yang H, Xing Y, Xie PNL, Rong K (2008) Carbon source/sink function of a subtropical, eutrophic lake fetermined from an overall mass balance and gas exchange and carbon burial balance. Environmental Pollution 15: 559-568.
Citation: Jana BB, Kundu D, Datta D, Lahiri S, Bag S, et al. (2016) Evidences of Manure Driven and C:N Regulated Enhanced Carbon Status and Microalgal Productivity in Managed Aquatic System under Simulated Green House Conditions. J Earth Sci Clim Change 7:336. Doi: 10.4172/2157-7617.1000336
Copyright: © 2016 Jana BB, et al. This is an open-access article distributed under the terms of the Creative Commons Attribution License, which permits unrestricted use, distribution, and reproduction in any medium, provided the original author and source are credited.
Share This Article
Open Access Journals
Article Tools
Article Usage
- Total views: 10648
- [From(publication date): 2-2016 - Apr 24, 2024]
- Breakdown by view type
- HTML page views: 10011
- PDF downloads: 637