Influence of Climate Change in Niger River Basin Development Authority Area on Niger Runoff, Nigeria
Received: 17-Apr-2014 / Accepted Date: 24-Oct-2014 / Published Date: 30-Oct-2014 DOI: 10.4172/2157-7617.1000230
Abstract
The influence of climate change on the runoff of Niger River is investigated for the period 1055-2010 using Gaussian Low Pass Filler, Spearman rank correlation co-efficient and multiple regression analysis. Niger River runoff is characterized by marked temporal variability which must have obliterated any trend in the long-term. An increasing trend which is insignificant (0.0226) during the long-term period (1955-2010) but significant (0.6762) in the recent period (1981-2010) has been detected. There is high positive correlation between annual rainfall (0.653) annual heavy rainfall (0.658) with annual runoff while (he correlation between annual temperature and annual runoff is significant but negative (-0.325). The multiple regression analysis shows that the annual rainfall, annual heavy rainfall and annual temperature account for 54.4% of its variance and are good predictors of runoff. The runoff of Niger River has been observed to be highly sensitive to changes in rainfall as a small increase or decrease in rainfall resulted in marked changes in runoff particularly in dry climate. The projected changes in runoff in the sub-Sahara Africa are consistent with the observed increase in the Niger River runoff.
Keywords: Climate; Runoff; Regression; Rainfall; Variance
Introduction
A Comparative assessment of fresh water resources by World Meteorological Organization [1] estimated that up to two-thirds of the world’s population would be living in water-stressed countries by 2025. In addition, one estimate shows the proportion of the African population at risk of water stress and scarcity increasing from 47% in 2000 to 65% in 2025 [2]. Water in the Upper and Lower Niger Basin Development Authority Area (U&LNRBDA) is a vital resource with high rainfall variability and existence of water supplies which are only marginally adequate to maintain acceptable levels of food production and to meet other basic human needs. In the water sector, assessment of surface water resources as a basis for planning and development of water projects is always carried out on the basis of long-term flow characteristics [3]. The monitoring of a river flows at a single point, integrating the rainfall-runoff process over a wide area, provides a reasonable picture of the time variations of water availability [4]. The total annual runoff over the land surface is projected to increase as a result of climate change even though there are regions with significant increase and significant decrease in runoff [5]. Arnell [6] projected a significant decrease in runoff in North and South Africa while the runoff in eastern Africa and parts of semi and sub-Sahara Africa is projected to increase. Milly, et al. [7] on the other hand projected decrease in runoff for parts of West Africa.
In the semi-arid and sub-Sahara Africa in which the study area is located, annual rainfall has been observed to decrease from 1968 [8-13]. However, a study by Babatolu et al. [14] reported a return of runs of good rainfall in NRBDA from 1994. This corroborates the observation of Malhi and Wright [15] and Brooks [16] that improvement occurred in Sahel rainfall which continued into the early 21st century. The mean annual temperature was also observed to increase in the period 1951- 2010 in U&LNRBDA [17] tracking the observed temperature trends for the northern hemisphere [18,19]. The increase in annual rainfall and mean annual temperature is likely to have significant consequence on runoff.
Over the past three decades, there have been numerous studies of the hydrologic effects of climate change [20-28]. These studies investigated the effects of changes in temperature and precipitation on mean monthly, seasonal or annual runoff using models which, most of the times, may over estimate or under estimate climate variables and produce large percentage changes in simulated runoff.
Some studies have also focused on hydrological effects of climate change using climate and runoff measured data. In some of these studies, significant trends in runoff have been detected while many found no trends. Some have also demonstrated statistically significant links with trends in temperature and precipitation. Long term runoff series in the Western U.S. were examined for evidence of secular changes related to climate based on data collected between 1932-80 mainly by Meko and Stockton [29]. They found that annual runoff series indicated that significant hydrologic changes related to combined influence of temperature and precipitation. Long term runoff series in the Western U.S were examined for evidence of secular changes related to climate based on data collected between 1932-80 mainly by Meko and Stockton [29]. They found that annual runoff series indicated that significance hydrologic changes related to combined influenced of temperature and precipitation have taken place within this period. Wahl [30] examined trends using annual runoff data and 58 stations in the Western U.S. for period ranging from 37-81 years in length and all ending in 1980. He found statistically significant trends in annual runoff at a 95% confidence level at only 5 of the 58 stations. Chiew and Mcmahon [31] investigated trends in annual streamflow related to changes in climate. They did not find evidence of changes in stream flow of 30 irregulated Australian river attributable to climate change. They suggested that the detection of statistically significant trends in stream flow is largely affected by interannual variability in stream flow and to less extent to the length of stream flow record. Leppi [32] analysed mean August discharge at 153 streams throughout the Central Rocky Mountains of North America for changes in discharge from 1950-2008. The analysis indicated that August discharge had generally declined over the last half century; the frequency of low discharge values had been greater in the last 8 years than the previous decades and changes in air temperature cause or, at least, influences changes in August discharge.
Rood et al. [33] examined the annual stream discharge of 31 rivers over various period from 1910-2002 in the Central Rock Mountains of North America near the United States and Canada border and found a decreasing trends of 0.1% per year over the historical record for 21 of the 31 river analyzed. Another study in the region has also demonstrated a decline in annual stream flow distribution from 1948-2006 [34]. McCabeJr, et al. [35] examined the statistical likelihood of detecting trends in annual runoff in the conterminous United States of America. They observed that the highest probability of detecting a trend is in the North-Western U.S., the Great Lakes region, the North Eastern U.S., the Appalachian Mount and parts of the Northern Rock Mountains. The least probability of trends detection is in the Central and South Western U.S. and Florida. Shiklomanor et al. [36] detected that trends in maximum discharge of the small to medium sized rivers were generally consistent with aggregated signals found for the downstream gauges of the six largest Russian rivers.
Significant decreasing trend in River Niger runoff measure at Lokoja was observed in the period 1956-1990 and became more pronounced in the 1980s in sympathy with rainfall decline [37]. Faure and Gac [38] used unweighted 7-year running mean of annual Senegal River runoff to predict future rainfall trends in the Sahel. They forecast a return to wetter conditions by 1985. Palutokof [39] correlated runoff data with normalized annual rainfall departure for the Sahel and found that Senegal River discharge data are good proxy for Sahelian rainfall.
Despite the improvement in the ability to model global climate systems, major gaps remain in our understanding of the impact of climate change at regional level. Of course, among the most important impacts to society of climate change are changes in regional water availability, specifically, the timing and magnitude of surface runoff variability. Such hydrologic changes are likely to affect every aspect of human well-being for agricultural productivity and energy used for flood control, municipal and industrial water supply and fish and wildlife management.
The tremendous importance of water for both societal and ecological needs underscored the necessity to improve our knowledge regarding how a change in climate would affect runoff and regional water supplies. A runoff trend in response to climate change has been well documented in the mid-and high latitudes but only very few of such studies have been carried out in Africa. In this study, therefore, trends in River Niger runoff are evaluated. Its consistence with changes in temperature and rainfall will also be investigated.
Materials and Methods
The study area
The Niger River Basin Development Authority area which is divided into Upper and Lower Niger Basin Development Authority areas (U&LNRBDA) are located in the middle belt of Nigeria between latitude 7°N and 12°N and between longitudes 3° and 9°E (Figure 1). The study area is characterized by rainfall which varies in amount from 100 mm in the north and 1300 mm in the south. The annual rainfall is concentrated in the rainy season during which about 80% of the rain falls. The rainy season lasts 5-6 months between April and September.
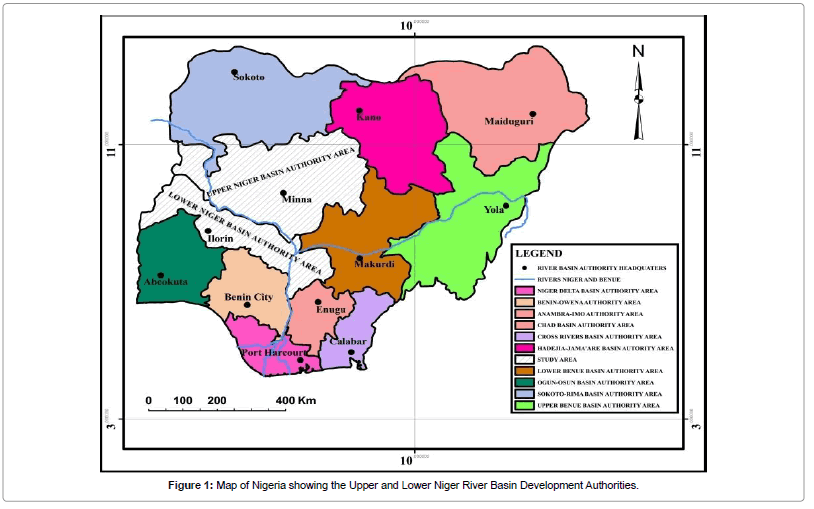
Figure 1: Map of Nigeria showing the Upper and Lower Niger River Basin Development Authorities.
The rainy season in the U&LNRBA areas is mainly linked to the northwards and southwards movement of Inter-Tropical Convergence Zone (ITCZ) which is associated with the migratory patterns of the sun although with time lag of about a month or two. The rainfall pattern resulting from the influence of the movement of the ITCZ and the weather system consist of double maxima in the south and single maxima in the north. The mean annual temperature of the area ranges between 27°C in the south and 22°C in the north east.
The relief of the study area consists of Western Uplands to the south which is about 600 meters above sea level and the North-Central Plateau to the north which is also about 1200 meters above sea level separated by the Niger Trough. Most of the tributaries of River Niger take their sources from these highlands (Figure 2). Niger River is 4200 km long from its source in Futa Jalon Plateau to its mouth in the Atlantic ocean; 1200 km of which flows in Nigeria [40]. The stretch of the river from where it enters Nigeria to Lokoja (Figure 1) receives its main supplies of water from rainfall of U&LNRBDA area and from such major tributaries as the Kaduna, Kampe, Swashi, Moshi, Awon, Kontagora, Eku, Oshin and Oyun.
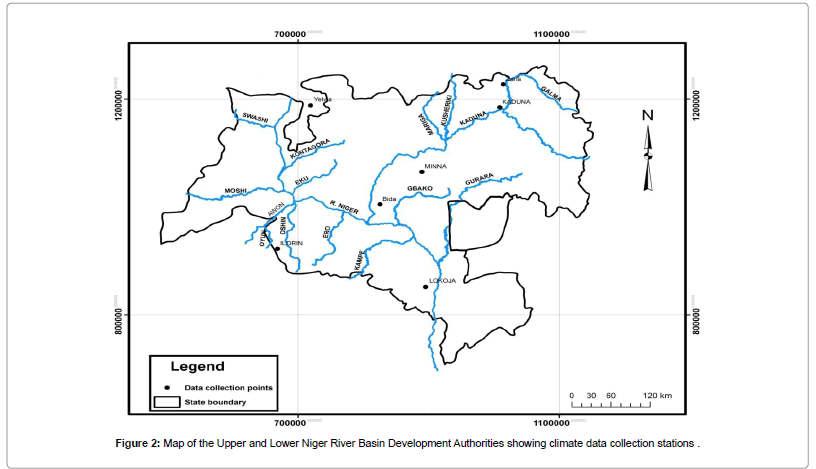
Figure 2: Map of the Upper and Lower Niger River Basin Development Authorities showing climate data collection stations.
Apart from the Niger trough, most of this region is covered by the guinea savanna which decreases in luxuriance northward in sympathy with rainfall.
U&LNRBDA area is undergoing rapid urbanization and large economic development leading to fast population growth in view of relocation of the Federal Capital Territory, to creation of more states and the establishment of Ajaokuta Steel Company in the area. These have led lo large-scale deforestation, additional demand for water for agricultural and municipal use, siltation and increase in relative amount of drainage basin area which is made impervious. These are various ways by which human activities have either increase or decrease runoff. It is, therefore, very difficult to isolate the impact of climate on water supply.
Data and data processing
The discharge data for River Niger were obtained from Nigeria Inland Waterway Authority, Lokoja for the period 1955-2010. Daily river discharge data from which annual runoff were extracted was obtained for only River Niger in the study area because of the scarcity of consistent and long discharge record. Daily rainfall, and monthly temperature data for seven stations from which annual rainfall, annual heavy rainfall and annual temperature were computed were obtained for the same period of record with runoff from the Nigerian Meteorological Agency. Stations were selected on the basis of completeness of records.
Statistical techniques
Each of the runoff and regional annual rainfall, annual heavy rainfall and mean annual temperature data was subjected to a Gaussian low-pass filter for fluctuations. Gaussian low-pass filter is used in order to smooth out short-term variations and highlight longer-term trends. It involves using nine weighting factors which conform to binomial coefficients: 0.22 for the central years (i) 0.20 for the years (i +/-1), 0.12 for the years (i+ /-2). 0.05 for the years (i+/-3) and 0.02 for the years (i+/-4). The mathematical operation of Gaussian low-pass filters has been detailed by Mitchell et al. [41] add its application lo meteorological data has been discussed by Craddock [42].
Niger runoff series was investigated for trends using Spearman rank correlation coefficient. Trends refer to monotonic increase or decrease in average value between the beginning and end of a time series [43].
Multiple regression analysis is also used to investigate the relationship between climate variables (temperature, rainfall and heavy rainfall) and runoff. The analysis will attempt to examine the variation in runoff explained by variations in temperature annual rainfall and annual heavy rainfall. Details of this method have been discussed by Johnston [44] and Shaw and Wheeler [45].
Result and Discussion
Temporal variability of Niger River runoff
Niger River runoff series indicates that the river has experienced alternating high and low runoff episodes on annual to decadal timescales during the 56 years of record. In general, three phases of low and high river flow can be observed. The high runoff years were most frequent in period 1955-70 but, particularly in the 1960s. Runoff during this period was about 12.2 percent of the long term average.
Runoff showed dramatic decrease in the period 1971-1993 during which deviation of about 17.9 percent from the long term average was recorded. The low runoff commenced about 1971 and intensified in the 80s. 1994-2010 was another period of high runoff. This high water flow contrasts sharply with the low flow if the 80s. The runoff during this period was 10 percent above the long-term coverage.
It can also be observed in Figure 3 the temporal variability of the Niger runoff was characterized by persistence of low and high water flow of 5 to 10 or more years and this is consistent with the decadal time scale rainfall variability observed in annual rainfall and annual heavy rainfall in the study area which are generally concomitant. This is consistent with the observation of Farguharson and Sutcliffer [4] that river flows throughout much of sub-Sahara Africa are characterized by marked temporal variability and occasional periodicity. Another notable temporal characteristic of Niger River runoff series is that the regulating effects of Kainji and Jebba lakes is hardly detectable at Lokoja as runoff comparable to pre-1967 (when the reservoir was constructed) were recorded in the post 1967. Selecting ten years with the highest runoff in the series, 1955 was the highest with 1969, 1999, 1997, 1995, 2010, 2009, 1962, 1968 and 1998 next in line. It can also be observed that since the 1970-93 droughts, Niger River runoff has not returned to its pre-1970 level despite those five out of ten years (3rd, 5th, 6th, 7th and 10th) listed as highest runoff years are in the post drought period. While runoff in the pre-drought was 12.2 percent above long-term average, it was 10 percent in the pre-drought era. Adefolalu [46] observed that since the 1969-73 droughts, River Niger and Benue might have not returned to their pre-1970 levels and size.
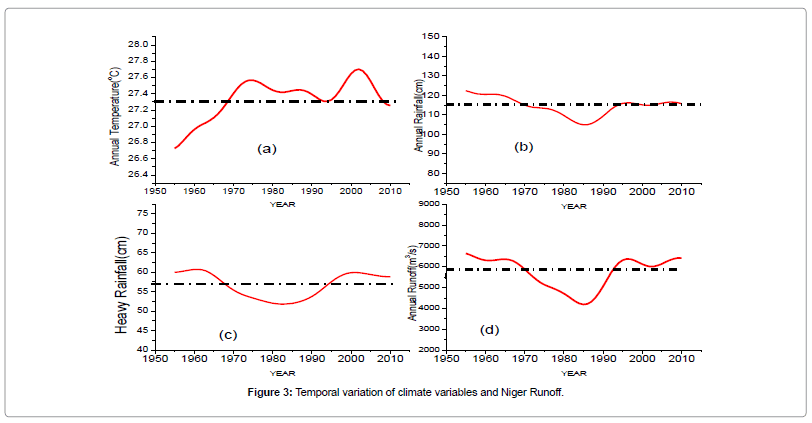
Figure 3: Temporal variation of climate variables and Niger Runoff.
The observed increase in runoff of this period is likely due to human-induced climate change. This is consistent with the projection of Arnell [6] showing significant runoff increase for parts of semi-arid sub-Sahara Africa in the 21st century. Also, IPCC [5] observed that by the middle of the 21st century, annual average river runoff and water availability are likely to increase as a result of climate change at high latitudes and in some wet tropical areas and decrease over some dry regions at mid-latitude
Trends in annual runoff in the U&LNRBDA area
The runoff series of Niger River was subdivided into 1955-70, 1971-93 and 1994-2010 reflecting the major runoff anomalies that have afflicted the river in the study period. Furthermore 1971-93 periods were divided into1971-80 and 1980-93 to evaluate the consistency of the observed changes. The results on Table 1 show the deviation of the average value of each sub period from the long-term average.
It can be observed from Table 1 that Niger runoff variability over time in U&LNRDA area is striking, increasing from 1955-70 period and nose diving from 1970 to the lowest flow in the 80s and increasing again from about mid-90s. The deviation from the mean value for the pre-1970 period was 12.2 percent indicating an above average runoff recorded during this period. It should be remarked that the much publicized 1972/73 drought which devastated the northern part of Nigeria has little effect on runoff in the 1971-80 period, when compared with the 80s. It appears that the persistence of dry conditions rather than the occurrence of exceptionally dry year or two has the greatest impact on water supply.
| Sub periods | Deviations (%) |
|---|---|
| 1955-70 | +12.2 |
| 1971-93 | - 17.9 |
| 1971-80 | - 10.9 |
| I981-93 | -24.8 |
| 1994-2010 | +10.0 |
Table 1: Deviation of the mean runoff of different subperiods from the long-term mean.
The annual runoff of Niger River was tested for trends using Spearman’s rank correlation coefficient for the base period (1955- 2010) and the last 30 years (1981-2010). The results show insignificant increasing trend (0.0226) during the period 1955-2010 but significant increasing trend (0.6762 at a 99% confidence level) m the recent period, 1981-2010. The lack of significant trend in the period I955-2010 may be due to the wide inter-annual variability in the Niger River runoff. Though no statistically significant trend is detected in the long-term Niger runoff data, the river has nevertheless experienced an increase in runoff over time during the study period which is important information for scientists and policy makers in the country. It is established that statistical significance is a common means differentiating long-term trends from patterns that occur by chance. Information from trends that are not statistically significant can be useful and sometimes statistically significant trends are not useful information [47,48]. Wahl [30] observed that even with notable changes in climate condition, statistically significant trends in annual runoff were difficult to detect. The result is corroborated by Chiew and McMahon [31] who detected no evidence of changes ranking from climate change in the runoff of 30 unregulated Australian rivers they examined. Also Wahl [30] found statistically significant trends in annual runoff at only 5 out of 58 stations examined in western conterminous United States of America.
Climate/Runoff relationship in the U&LNRBDA area
In this section, climate variables and runoff data in the U&I. NRBDA area for the same number of years were employed to deduce climate/runoff relationships. The graphs in Figures 3b-3d have shown that the changes in the regional rainfall variables and runoff at Lokoja are concurrent, although the magnitude of change in the latter is more severe. The decrease in rainfall variables is likely to be the primary factor causing decrease in runoff. It is clear from the graphs that major variations in runoff have closely matched the variations in annual rainfall and annual heavy rainfall. For instance, the wet period of 1955-69 in the study area was reflected in the above average runoff during this period. In the same vein, the drought of 1971-93 in the study area could be seen to coincide with the period of flow runoff'. This is consistent with the observation of Opoku-Ankomah & Amisigo [3] that the changes in runoff and amount of water resources could be attributed in a large measure to the changes in the precipitation phase of hydrological cycle.
Figures 3b-3d thus shows that the variability in the Niger River flow at Lokoja mirrors the U&LNRBDA area rainfall variability. According to Rybkina [49], in the river basins where the rivers are fed exclusively by rain, the yearly runoff variation is determined by rainfall conditions.
The runoff of the Niger River at Lokoja can be used as a proxy of rainfall anomalies of the U&LNRBDA area. The result agrees with the finding of Lamb [50] that some indications of pre-1941 Sahelian climate variability can be gleaned from hydrological data of Senegal and Niger River and Lake Chad amongst other sources. Palutikof [39] in his study also found that Senegal rivers discharge data are good proxy of Sahelian rainfall.
With regard to temperature and runoff relationship, the graphs in Figures 3b-3d show that none of the major variations in runoff are in phase with those of temperature except for the above average temperature and runoff in the period 1994-2007. In wet and dry climate, the negative effects of temperature on runoff becomes significant during the dry season and drought period as decreased rainfall and increased temperature increase evapotranspiration, water demand for hydropower municipal and irrigation purposes. These results are pronounced decrease in runoff. The decrease in runoff compared to rainfall in the period 1971-1993 (Table 2) must have been the result of the increase in evapotranspiration (occasioned by high temperature) and decrease in rainfall.
Thus a given percentage change in rainfall results in magnified change in runoff, that is, a more severe change in runoff. For instance, an increase of 5.6 percent annual rainfall resulted in annual increase of 12.2 percent. While a decrease of 0.36 in rainfall resulted in 10.9 percent decrease in runoff. It can, therefore, be suggested that runoff is very sensitive to change in climate. It also appears from Table 2 that a greater change in runoff was shown to result from drier climate.
| Sub periods | Change in rainfall (%) | Change in rainfall (%) |
|---|---|---|
| 1955-70 | 5.6 | 12.2 |
| 1971-80 | -0.36 | -10.9 |
| 1981-93 | -8.7 | -24.8 |
| 1971-93 | -3.5 | -17.9 |
| 1994-2010 | 1.4 | 10.0 |
Table 2: Rate of Change in Runoff during the Major Temporal Variability in Rainfall.
The degree of temporal coherence between climate variables and runoff series in the period I955-2010 has been tested for significance using multiple regression analysis. The results are presented in Table 3. The results on Table 3 show a significant negative correlation between annual mean temperature and runoff in the study area indicating that after accounting for annual rainfall and annual heavy rainfall variables, higher annual temperature were expected to reduce annual runoff. Annual temperature significantly predicted annual runoff t(52)=-2.74, P
| Climate variables | Period | Correlation |
|---|---|---|
| Annual temperature | 1955-2010 | -0.325* |
| Annual rainfall | 1955-2010 | 0.653** |
| Annual heavy rainfall | 1955-2010 | 0.638** |
**Significant at 99% probability level
*Significant at 95% probability level
Table 3: Climate Correlation in the NRDBA Area, Nigeria.
It is also observed from Table 3 that a very significant positive correlation exists between the annual rainfall and annual runoff in the study area indicating that any increase in annual rainfall causes an increase in annual runoff. Annual rainfall significantly predicted annual runoff. t(52)=3.42, p<.05 and explaining 43% variance (1.2 of 0.653 =0.426) in annual runoff. The high positive correlation between annual rainfall and annual runoff may be due to the fact that rivers in the study area are fed exclusively by rain and hence the importance of annual rainfall. Muller et al. [51] found that runoff data were used to better select historically significant precipitation events.
There is high positive correlation between annual heavy rainfall and annual runoff (Table 3) indicating that the more the amount of heavy rainfall the more the runoff. Annual heavy rainfall significantly predicted annual runoff, t (52) -2.64, p<.05 accounting for 38% variance (r2 of 0.612 - 0.375) in annual runoff. The result may be explained by the fact that heavy rainfall has been increasing in the study area. For instance, in the period 1955-2010 the proportion of the annual rainfall that fell as heavy rainfall was 40%. This increased to 50.1% in the period 1981-2010. Milly et al. [52] found that great floods have increased worldwide in the twentieth century and are connected with heavy precipitation events [51]. Heavy precipitations were projected to become more frequent over most regions throughout the 21st century and this would affect the risk of flash flooding and urban flooding [5]. Heavy rainfall influences runoff because the intensity of most heavy rain events always exceeds the infiltration capacity of the soil. Much of the rainfall will, therefore, flow over the ground surface, possibly directly into the streams and rivers increasing runoff. This is more so when heavy rainfall is reflected in increase in rain drop size which increases the compaction of the soil, thus increasing overland flow.
A multiple regression analysis was performed using annual runoff as the criterion and climate parameters including annual rainfall, annual heavy rainfall and annual temperatures as predictors in order to determine if annual runoff could be produced as a function of annual rainfall, annual heavy rainfall and annual temperature (Table 4). The analysis was found to be statistically significant (F (3.35=20.72, P<0.001) indicating that annual rainfall, annual heavy rainfall and annual temperature are good predictors of annual runoff. The multiple regression models was a good fit as the three predictors account for 54.4% of variance in annual runoff (Adjusted R2=518).
| VARIABLES | B | SEB | P | T-VALUE | P- VALUE |
|---|---|---|---|---|---|
| Annual temperature tttyreTTEMPERATURETEMPERAYURE | -845.238 | 341.825 | -.234 | -2.473 | 0.017 * |
| Annual rainfall | 45.817 | 13.404 | .417 | 3.418 | 0.001 ** |
| Annual heavy rainfall | 52.158 | 19.780 | .321 | 2.637 | 0.011 * |
**Significant at 99% probability level
* Significant at 95% probability level
Table 4: Multiple Linear Regression Results for the Effects of Temperature, Rainfall and Heavy Rainfall on Niger Runoff.
Predicting Niger runoff under changing climate
In this section, an attempt is made at preliminary prediction of Niger runoff due to climate change. This is based on the fact that Niger runoff is highly correlated with changes in climate (Table 3), since the strength of relationship between climate variables (annual temperature, annual rainfall and annual heavy rainfall) in the U&LNRBDA has been established (Table 4), runoff can be predicted given specific changes in climate variables. The analysis of multiple regression of climate variables and runoff performed in section 3.3 yielded the following equations; Y=b0 + b1X1 + b2X2+ b3X3 where
Y1=Runoff
bo=regression weight for the intercept (constant)
b1=regression weight for annual temperature
b2=regression weight for annual rainfall
b3=regression weight for annual heavy rainfall
X1=annual temperature
X2=annual rainfall
X4=annual heavy rainfall
The multiple regression formula for calculating predicted runoff is stated below;
Runoff (Y1) = 20583.848 – 845.238×X1+ 45.817 ×X2 + 52.158×X3.
Hypothetically prediction of runoff from annual temperature, annual rainfall annual heavy rainfall is given in Table 5.
| Annual Temp (°C) | Annual Rainfall (mm) | Annual Heavy Rainfall (mm) | Point Prediction Runoff (m3/8) | t.value | Approxst. Error of pred. | Margin error | Approx. 95% PI. | ||
|---|---|---|---|---|---|---|---|---|---|
| Lower Bound | Upper bound | Interval width | |||||||
| 26.50 | 110.00 | 49.50 | 5807 | 2.007 | 893.52 | 1792.97 | 4014 | 7600 | 3586 |
| 27.00 | 115.50 | 50.15 | 5670 | 2.007 | 893.52 | 1792.97 | 3877 | 7463 | 3586 |
| 27.20 | 120.00 | 50.50 | 5726 | 2.007 | 893.52 | 1792.97 | 3933 | 7518 | 3586 |
| 27.70 | 121.00 | 60.40 | 5865 | 2.007 | 893.52 | 1792.97 | 4072 | 7658 | 3586 |
| 27.80 | 113.00 | 57.10 | 5251 | 2.007 | 893.52 | 1792.97 | 3458 | 7044 | 3586 |
Table 5: Hypothetically Prediction of Runoff from Annual Temperature, annual rainfall and Annual Heavy Rainfall.
The first row on Table 5 indicates that given an hypothetical annual temperature of 26.5°C, annual rainfall of 110.0 mm and annual heavy rainfall (mm), the predicted runoff (point prediction) is 5807 m3s. Table 5 also shows an approximately 95% confidence that the point prediction of runoff is between 4014 and 7600 m3/s. This analysis confirms that annual temperature, annual rainfall and annual heavy rainfall are good predictors of annual runoff in the study area. This is clearly seen when the hypothetical prediction of runoff is compared with the actual temperature and rainfall values. The values of the climate variables in the first row of both Tables 5 and 6 which are almost the same, except for annual rainfall which is higher in Table 5 produce highly comparable runoff.
Climatic variables in row five on Table 5 and row three on Table 6 also produce very comparable runoff.
| Year | Annual Temperature | Annual Rainfall | Annual Heavy Rainfall | Annual Runoff |
|---|---|---|---|---|
| 1956 | 26.5 | 103.9 | 49.7 | 5356.9 |
| 1965 | 27.0 | 112.0 | 53.8 | 6426.6 |
| 2002 | 27.8 | 107 | 57.1 | 5352.9 |
| 2004 | 27.7 | 121 | 60.4 | 6165.3 |
Table 6: Actual Annual Temperature, Annual Rainfall, Annual Heavy Rainfall and Annual Runoff of selected years in the study Area.
From the results presented above, climate change impact on runoff can be detected despite the fact that the study area has been experiencing rapid urbanization, deforestation, phenomenal population growth, widespread irrigation farming, reservoir impoundment for hydropower and siltation in rivers, all of which are capable of exaggerating the impact of climate change. Javanovic [53], however, found that the use of water for hydropower and navigation utilizes water without considerable change in the balance of discharge. Contrary to Niger River basin, Conway [54] found that there is no clear indication of how Nile River flow would be affected by climate change because of uncertainty in projected rainfall patterns in the basin and in the influence of complex water management and governance structure.
Conclusion
Niger River runoff trends in response to climate change have been evaluated in the study. Its consistence with changes in temperature and rainfall was also investigated. The variation observed in runoff series reflects in the regional climate variation particularly rainfall variation. It is demonstrated in the study that a small increase or decrease in rainfall resulted in marked changes in runoff.
Examination of trends in Niger River runoff showed that Niger runoff is increasing which is consistent with the projection that runoff in West Africa or sub-Sahara would likely increase in the 21st century. It was observed that Niger River runoff is characterized by marked temporal variation which must have hidden any significant long-term trend. The dominant drivers of Niger runoff are annual temperature, rainfall and heavy rainfall.
Climate change, therefore, is likely to alter river discharge in the study area resulting in important impacts on water availability for instream usage particularly hydropower generations and water transport. Flood damages may also increase.
Acknowledgements
The authors appreciate TETFUND whose financial support made this study possible. The authors also acknowledge the Nigeria Meteorological Agency for the rainfall and temperature data.
References
- World Meteorological Organization (1997) A comprehensive Assessment of the Freshwater Resources of the World. WMO, Geneva.
- Aston PJ (2002) Avoiding conflicts over Africa’s water resources.Ambio 31: 236-242.
- Opoku-Ankomah Y, Amisigo BA (1998) Rainfall and runoff variability in the Southwest River System of Ghana. In water resources variability in Africa during the xxth century. Proceedings of the Abidjan 98 conference held at Abidjan Coted’Ivoire. IAJS Publ. No 252: 307-314.
- Farquharson FAK, Sutchiffe JV (1998) Regional variations of African river flows. In: Water Resources Variability in Africa during the xxth century. Proceedings of the Abidjan ’98 Conference held at Abidjan Coted’ Ivoire. IAHS Publ. No 252: 161-169.
- Intergovernmental panel on Climate Change (IPCC) (2007) Climate change 2007 Impacts Adaptation and Vulnerability, Contribution of Working Group II to the Forth Assessment Report of the Intergovernmental Panel on climate change. Parry ML, Canziani OF, Palutokof JP,Vander Luden PJ, et al. (Edn) Cambridge University Press, Cambridge976.
- ArnellNW (2004) Climate change and global water resources: SRES emissions and socio-economic scenarios. Global Environ chang 14: 31-52.
- Milly PCD, Dunne KA, Vecchia AV (2005) Global pattern of trends in streamflow and water availability in changing climate. Nature 438: 347-350.
- Nicholson SE (1989) Long-term changes in African rainfall. Weather 44: 46-56.
- Olaniran OJ, Sumner GN (1990) Long-term variation of annual and growing season rainfalls in Nigeria. Theor Appl Climatol 41: 41-53.
- Nicholson SE (2001) Climate and environment change in Africa during the last two centuries.Clim Res 17: 123-144.
- Hulme M, Doherty T, New M, Lister D (2001) African climate change: 1900-2100. Climate Res 17: 145-168.
- Chappell A, Agneir CT (2004)Modelling climate change in West Africa Sahel rainfall (1931-90) as an artifact of changing station locations. Int J Climatol 24: 547-554.
- Dai A, Lamb PJ,Trenberth KE, Hulme M, Jones PD, et al. (2004)The recent Sahel drought is real. Int J Climatol 24: 1323-1331.
- Babatolu JS, Akinnubi RT (2013) Surface temperature anomalies in the river Niger Basin Development Authority areas, Nigeria. Atmos Climate Sci 3.
- Malhi Y, Wright J (2004) Variability of the recent climate of Eastern Africa. Int J Climate 24: 681-701.
- Brooks N (2004) Drought in the African Sahel: Long-term perspective and future prospects. Tyndall centrefor climate change research 61.
- Babatolu JS, Akinnubi RT, Akintade TF, Omosuyi OB (2013) An Investigation of rainfall variability in the Upper and Lower River Niger Basin Development Authority areas, Nigeria. Int J Basic Appl Sci 2: 393-398.
- Jones PD, Parker DE, Osborn TJ, Briffa KR (2011) Global and Hemisphere temperature anomalies- land and marine instrumental records, Trends: A compendium of data on global change. Carbon Dioxide Information Analysis Centre (CDIAC), Oak Ridge National Laboratory, US Department of Energy, Oak Ridge Tenn.
- Intergovernmental Panel Climate Change (IPCC) (2001)The Scientific Basis. Contribution of Working Group to the Third Assessment. Report of the Intergovernmental Panel on Climate Change. Cambridge University Press, Cambridge.
- Nemec J, Schaake J (1982) Sensitivity of water resources system to climate variation. Hydrol Sci 27: 327-343.
- Revelle RR, Waggoner PE (1983) Effects of a carbon dioxide induced climatic change on water supplies in the Western United States.In: Changing Climate National Academy of Sciences, National Academy Press Washington D.C 419-432.
- Gleick PH (1989) Climate change, hydrology and water resources. Rev Geophys 27:329-344.
- McCabe GJ, Hay LE (1995) Hydrological effects of hypothetical climate change in the east river basin, Colorado, USA. J Hydrol Sci 40: 303-318.
- Gellens D, Rowlin E (1998)Streamflow response of Belgian catchments to IPCC climate change scenarios. J Hydrol 210: 242-258.
- Graham LP (2004) Climate change effects on river flow to the Battic Sea. Ambio 33: 225-241.
- Manabe S, Milly PCD, Withered R (2004) Simulated long-term change in river dischange and soil moisture due to global warming. Hydrol Sci J 49: 625-642.
- Arnell NW (2004) Climate-change impact on river flows in Britain: The UKCIPO2 scenarios. Water Environ J 18: 112-117.
- Thodsen H (2007)The influence of climate change on steamflow in Danish rivers. J Hydrol 333: 226-238.
- Meko DM, Stockton CC (1984) Secular variation in streamflow in the Western United States. J Climatol Appl Meteorol 23: 889-897.
- Wahl KH (1991) Is April to July runoff really decreasing in the Western United States? In: Shafen B. (Edn) Proceedings of Western Snow Conference Juneau, A.K. Colorado State University Press. Fort Collins Co. 67-78.
- Chiew FHS, McMahon TA (1993) Detection of trend or change in annual flow of Australian rivers. Int J Climatol 13: 643-653.
- Leppi JC, Deluca TH, Harra SW, Running SW (2012) Impacts of Climate change on August stream discharge in the Central-Rocky Mountains. Climate chang 112: 997-1014.
- Rood SB, Samuelson GM, Weber JK, Wywrot KA (2005) Twentieth-century decline in streamflow from the hydrographic apex of North America. J Hydrol 306: 215-233.
- Lace CH, Holden ZA (2009) Declining annual stream flow distributions in the Pacific Northwest United States, 1948-2006.Geophyc Res Lett 36.
- Mccabe Jr GI, Wolock DM (1997) Climate change and the detection of trends in annual runoff. Clim Res 8: 129-134.
- Shiklomanor AI, Lammers RB, Rawlins MA, Smith LC, Pavelsky TM (2007) Temporal and Spatial variations in maximum riverdischange from a new Russian data set. J Geophys Res 112.
- Babatolu JS (1998) Climatic change and its Implication for Water Supply in the Niger River Basin Development Authority Area. An Unpublished Ph.D Thesis submitted to the Department of Geography, University of Ilorin, Ilorin.
- Faure H,Gac JY (1981) Will the Sahelian drought end in 1985? Nature 291: 5815.
- Iloeje NP (1976) A New Geography of Nigeria. Great Britain: Fletcherd Son Ltd 64-66.
- Mitchell JM, Dzerdzeevskii B, Flohn H, HofineyWL, Lamb HH, et al. (1966) Climate Change. World Metrological Organization, Geneva, WMO Tech 79: 80.
- Craddock JM (1968) Statistics in computer age The English University Press, London, 214.
- Giles BD, Flocas AA (1984) Air temperature variations in Greece part 1 persistence trend and fluctuations. J Climatol 4: 531-539.
- Johnson RJ (1978) Multivariate Statistical analysis in Geography London. Longman press 60-87.
- Shaw G, Wheeler D (1985) Statistical technique in Geographical Analysis. Chichester, John Wiley and Sons P 229-247.
- Adefolalu DO (1995) Towards Improving Dam Designing for Energy Development by National Electric Power Authority (NEPA). The need for Micro-studies on perception – effectiveness. Inc: Umolu, P.E. (Edn) Global Climate Change: impact on energy development. Jos. Damtech Nig. Ltd. 212-219.
- Daniel WW (1978) Applied nonparametric statistics. PWS-Kent Publications, Honton.
- Yue S, Pilon P, Cavadias G (2002a) Power of the Mann-Kendall and Spearman’s role tests for detecting monotonic trends in hydrological series. J Hydro 259: 245-291.
- Rubkina AJ (1978) Annual distribution of runoff in Africa. In: World water balance and water resources of the earth: U.S.S.R Committee for the International Hydrological Decade UNESCO 286-291.
- Muller M, Kaspar M, Matschullat J (2009) Heavy rains and extreme rainfall-runoff events in Central Europe from 1951-2002. Nat Hazard Earth System Sci 9: 441-450.
- Milly PCD, Wetherald RT, Dure KA, Delworth TL (2002) Increasing risk of great floods in changing climate. Nature 415: 514-517.
- Javanovic D (1971) Water Resources Inventory In: The role in Hydrology and hydrometeorology in the economic development of Africa. Technical papers presented to the ECA. WMO Conference, Addis Ababa.
- Conway D (2005)From headwater tributaries to International River: Observing and adapting to Climate variability and change in the Nile Basin. Global Environ Chang 15: 99-114.
Citation: Babatolu JS, Akinnubi RT (2014) Influence of Climate Change in Niger River Basin Development Authority Area on Niger Runoff, Nigeria. J Earth Sci Clim Change 5: 230. Doi: 10.4172/2157-7617.1000230
Copyright: ©2014 Babatolu JS, et al. This is an open-access article distributed under the terms of the Creative Commons Attribution License, which permits unrestricted use, distribution, and reproduction in any medium, provided the original author and source are credited.
Share This Article
Open Access Journals
Article Tools
Article Usage
- Total views: 16817
- [From(publication date): 11-2014 - Apr 25, 2024]
- Breakdown by view type
- HTML page views: 12286
- PDF downloads: 4531