Multi-Temporal Remote Sensing of Landscape Dynamics and Pattern Changes in Dire District, Southern, Ethiopia
Received: 24-Jul-2014 / Accepted Date: 30-Sep-2014 / Published Date: 10-Oct-2014 DOI: 10.4172/2157-7617.1000226
Abstract
Science and reporting information needs for monitoring dynamics in land-cover over time prompted research, and made operational, a wide variety of change detection methods utilizing multiple dates of remotely sensed data. Improper land use results in land degradation and decline in agricultural productivity. Hence, in order to get maximum benefits out of land, proper utilization of its resources is inevitable. The present study was aimed at identifying the land cover changes in the study area in the last 25 years and determines the extent and direction of change that has occurred. The study made use of Landsat TM 1986 and 2011 Remote Sensing Satellite Image for analysis to determine the extent and pattern of rangeland change. The results of the landuse/landcover change detection showed that in the last 25 years, 3 major changes were observed, grass land and open shrub land resource significantly decreased at a rate of 17.1 km2/year and 12 km2/year respectively. On the other hand in 25 years dense bushland, open bush land, dense shrub land and cultivated land has shown increment in size at a rate of 0.23 km2/year, 13.5 km2/year, 6.3 km2/year and 0.2 km2/year, respectively within 25 years. The expansion of unpalatable woody species significantly reduced the rangeland size and availability of grasses. The consequence of the decrease in herbaceous biomass production might result in high risk of food insecurity in the area unless proper interventions are made in time.
Keywords: GIS and remote sensing; Dire district; Landuse/Landcover; Landsat TM
Introduction
Ecological processes and human interventions are facilitating ecosystem changes as a whole and Land Cover Change (LCC) in particular. In particular term, LCC is a dynamic phenomenon occurring within the interface between human, agricultural and ecological systems [1]. Detection of changes of habitats is an important application of Remote Sensing, providing information to make decisions regarding resource management, and prediction of future environmental conditions [2]. It involves remotely sensed multi-temporal data sets to discriminate areas of land-cover changes between different periods of imagining [3]. According to Geist [4], it is the process of extracting the type, amount, location and configuration of changes on land-cover pattern with respect to time. Similarly, digital change detection is a method of identifying and quantifying differences in the state of an object or phenomenon from multi-date imagery [5]. In general, changes in vegetation are the most direct indicator of land degradation [6]. One of the primary applications of remote sensing in the rangelands is prediction of production potential of a ranch [7]. Using different imageries that have varying spatial and temporal resolution, it is possible to estimate grass biomass. Integrated with GIS, the system provides spatial and temporal information, which are valuable for inventory. Furthermore, range conditions can be relatively easily handled with low cost and effort. Using these modern techniques, the overall changes in grass cover of larger extents of areas, and related changes in biomass and other land-use pattern changes can be estimated.
Until very recently, the Borana rangelands of Southern Ethiopia were considered to be one of the best grazing lands in east Africa [8]. Since the early 1980s there is evidence that the system in the Borana rangeland is experiencing a decline in productivity, associated with periodic losses in cattle populations [9]. This was probably related to extreme climate change and variability, changes in land use, bush encroachment, suppression of fire that resulted in the proliferation of bush encroachment and a general decline in forage production overestimation of the grazing capacity [10]. In line with this fact, in the past three decades, the Borana rangelands have faced many problems and the threats are getting severe as time goes [11] which necessitates interventions based on land use/land cover evaluation. The Dire district is one of the Borena Zone, which is situated in Arid and Semi-Arid Lands (ASALs), it experiences low and erratic rainfall and high temperature that hinder any significant crop production. However, the expansion of unpalatable woody species significantly reduced the rangeland size and availability of grasses. The consequence, of the decrease in herbaceous biomass might result in high risk of food insecurity in the area. In addition, the bush prohibits access of livestock to the underlying grass and as the canopy closes the grasses and herbs disappear letting the ground susceptible to water erosion. Rapidly of bush encroachment and expansion cultivation land are great threats for livestock production in the area, which have caused increasing concern among managers and revealed the importance of land use/land cover analysis. However, no research has been reported to determine the kind and rate of the landuse/landcover changes for proper grazing plan in the area.
Up-to-date global land cover data sets are necessary for various global change research studies, including climate change, biodiversity conservation, ecosystem assessment and environmental modeling [12]. Since land cover is the actual distribution of physical and biological features of the land surface, up-to-date information on the status of the land surface is crucial for environmental planning and management reasons [13]. For sustainable management and decision making processes related to natural resources, knowledge about the ecosystem on both the temporal and the spatial scale is required [14]. This managerial decision on resources has to be based on change analysis, which is the comparison of the current status with past events. Acquiring of range land information can help in understanding historical variations of grazing land resources and thereby contribute to its proper management. In fact, vegetation types form one of the main resources of pastoral area. Sound decision on range management depends upon reliable information of the past and present vegetation resource. It was aimed to determine the temporal changes of landuse/ cover dynamics and quantify the rate and direction of these dynamics in the study area.
The study area
The present study area is bounded by latitude 4° 37' 0" - 4° 37' 10"N and longitude 37° 56' 0" - 38° 31' 0" E in Borena Zone, Oromia Regional State, Ethiopia, and covers a total area of 3921 km2 (Figure 1). The altitude ranges from 750 to 1870 m.a.s.l and the topography consists of isolated mountains, valleys and depression and the area is considered as a good representative of the Borana rangelands.
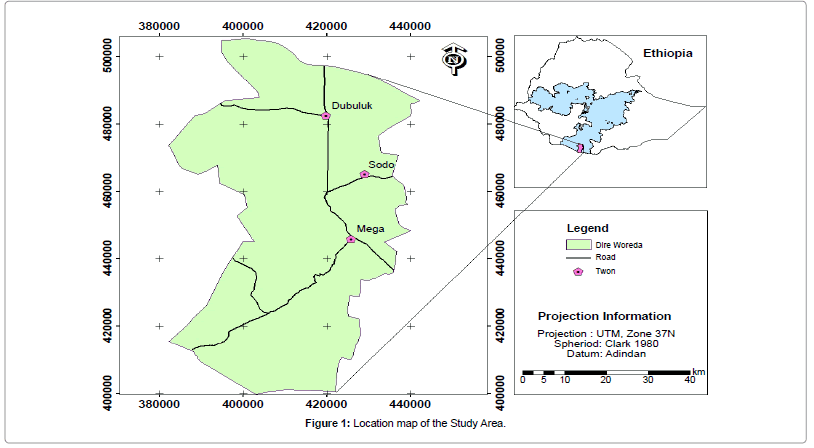
Figure 1: Location map of the Study Area.
The rainfall of the study area ranges between 300-900 mm with bi-modal monsoon rainfall type, where 60% of the annual rainfall occurs during March to May (Ganna) and 40% between September and November (Hagaya) [15]. The period from June to September is characterized by heavy cloud cover, mist and occasionally short showers, while the main dry season (Bonna Hagaya) occurs from November to March with high evaporation [15]. The overall average temperature ranges from an annual mean minimum of 13.3oC to annual mean maximum of 29.5oC.
The general vegetation type of the study area is Acacia savannah, the major trees being Acacia drepanolobium in black cotton soil, and Acacia brevispica and Acacia horrida on the slopes. According to Gemedo Dalle [16], Commbertum Terminalia and Acacia Commiphora woodlands characterize the lowlands of Borana zone. Bushlands and thickets, which cover major parts of the lowlands, are dominated by Acacia and Commiphora species. Besides, species of the genera Boscia, Maerua, Lannea, Balanites, Boswellia and Aloe are common in the study area [17].
Methods
To make the multi-temporal analysis and Landuse/landcover types at various times extraction Cloud free Landsat TM imageries (path 168 and row 57) that were acquired on January 1986 and 2011 were analyzed to classify the landuse/landcover change of the study area. All were acquired in the month of January during the dry season. Geometric correction and image enhancement were conducted using ERDAS Imagine 9.2. Unsupervised classification of the study area was performed prior to field visit and representative points thought to represent the various land cover classes were marked using GARMIN GPS during field visit. Using ERDAS software, 42 points (GCPS) were selected from each classified groups to be checked in the field. Later, some points were added in the field for class identification of images. For the year 1986, false color composite was prepared using the order of 4, 3, 2 band sequence and then different enhancements were made to increase the visual interpretation of the image. Based on the field check points, supervised classification approach with the maximum likelihood classifier system was applied to improve the accuracy of the land-use classification of the images for 1986 and 2011. Post classification comparison was carried out for two independent images (thematic maps). Difference or change information was generated by comparing image values of one data set (TM 1986) with those of the corresponding layer of the second data set (TM 2011). Conversion matrix between TM 1986 versus TM 2011 was compiled in the form of a contingency table. This conversion matrix was used to quantify land cover change in terms of pixel values, km2 or percentage of area coverage. The rate of land use/land cover change for each class was calculated as follows:
Rate of change (ha/year) = (A-B)/C
Where, A= recent land use/ land area in km2,
B= previous area of land use/ land cover in km2,
C= interval between A and B in years
Results
The landuse/landcover units of the study area were classified in to eight types; these are: forest, open bushland, dense bushland open shrubland, dense shrubland, grassland, farmland and bareland. The major portion of the landuse/landcover was dominated by grassland and open shrubland before 25 years but in 2011 it is dominated by open and dense bushland (Table 1 and Figure 2). The result of classification accuracy assessment. The overall accuracy and the Kappa value of field data versus automated classification results were 86.05% and 0.84, respectively.
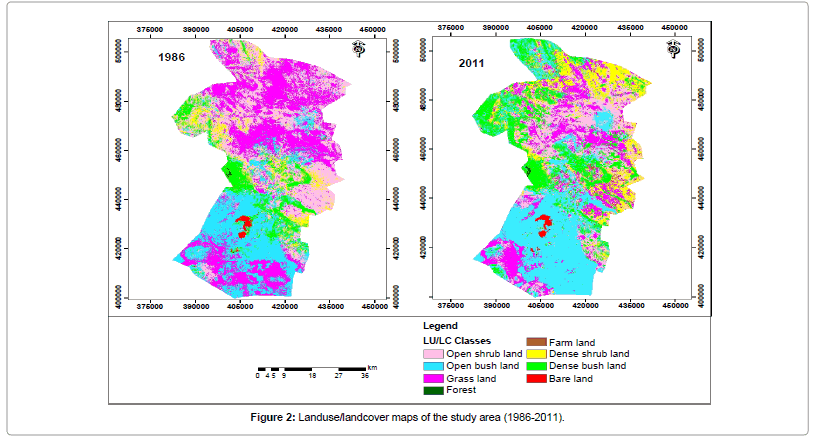
Figure 2: Landuse/landcover maps of the study area (1986-2011).
The results of land use/ land cover map (Figure 2 and Table 1) showed that the area of grassland and open shrubland and bareland has declined. The rate of change was greater in the grassland and shrubland than bareland classes. The area of open bush, dense bush and dense shrubland has increased rapidly while farmland and forest showed a general trend of increase in area coverage.
| Classes | Year1986 | Year 2011 | Change (km2) | Change (%) | ||
|---|---|---|---|---|---|---|
| Area (km2) | Area (%) | Area (km2) | Area (%) | |||
| Forest | 3.4 | 0.1 | 4.16 | 0.11 | 0.76 | 0.01 |
| Open bush land | 931.67 | 23.76 | 1270 | 32.39 | 338.33 | 8.68 |
| Dense bush land | 459.1 | 11.7 | 684.52 | 17.46 | 254.42 | 5.76 |
| Open shrubs land | 1068.8 | 27.26 | 769.87 | 19.63 | -298.93 | -7.63 |
| Dense shrub land | 341.3 | 8.71 | 498.76 | 12.72 | 157.46 | 4.01 |
| Grass land | 1090.17 | 27.8 | 663.35 | 16.92 | -426.82 | -10.88 |
| Farm land | 2.11 | 0.05 | 6.64 | 0.17 | 4.53 | 0.12 |
| Bare land | 24.45 | 0.62 | 23.7 | 0.6 | -0.75 | -0.02 |
| Total | 3921 | 100 | 3921 | 100 | ||
Table 1: Landuse/landcover classes and changes from 1986 to 2011 in Dire District of the Borena Zone.
Significant spatial expansion in open bushland, dense bushland and dense shrubland and the rapid decrease in grassland and open shrubland were observed in the 2011. The major cover changes observed during this period had been the reduction in the area of grassland from 27.8 % (1090 km2) in 1986 to 17% (663.4 km2) in 2011 with a rate of 17 km2/year while open shrub-land from 27% (1068.8 km2) in 1986 to 20% (770 km2) with a rate change of 12 km2/year (Table 2). The area of open bushland, dense bushland and dense shrubland were showed increasing pattern in study area over the analysis period. Of the total land area, the landcover by open bushland in Dire district was 24% (932 km2) in 1986. A consistent increase to 32% (1270 km2) with a rate change 13.5 km2/year throughout the analysis period while dense bushland from 11.7% (459 km2) to 16.5% (684.5 km2) with a rate of 0.23 km2/year. Dense shrubland increased from 8.7% (341.3 km2) to 12.7% (498.8 km2) with the rate of 6.3 km2/year. General patterns of land use/landcover identified in the two images were largely dominated by shrubland, bushland and grassland, areas (Table 2).
| Classes | Year 1986 | Year 2011 | Rate of change in ( km /year) | ||
|---|---|---|---|---|---|
| Area | Area | ||||
| km2 | % | km2 | % | ||
| Forest | 3.4 | 0.1 | 4.16 | 0.11 | 0.03 |
| Open Bush land | 931.67 | 23.76 | 1270 | 32.39 | 13.53 |
| Dense bush land | 459.1 | 11.7 | 684.52 | 17.46 | 0.23 |
| Open Shrubs land | 1068.8 | 27.26 | 769.87 | 19.63 | -11.96 |
| Dense shrub land | 341.3 | 8.71 | 498.76 | 12.72 | 6.3 |
| Grass land | 1090.17 | 27.8 | 663.35 | 16.92 | -17.1 |
| Farm land | 2.11 | 0.05 | 6.64 | 0.17 | 0.18 |
| Bare land | 24.45 | 0.62 | 23.7 | 0.6 | -0.007 |
| Total | 3921 | 100 | 3921 | 100 | |
Table 2: Landuse/landcover class change rate (1986-2011).
Error matrix for each land use/land cover is shown in Table 3. The overall accuracy and Kappa values were 86.05 and 0.84, respectively (Table 4). The classification of forest and farm land showed that 100% producer’s accuracy, which means no pixel, was incorrectly excluded from its category. However, dense bushland, dense shrubland, open bushland, open shrubland, grassland bareland and showed the omission of 22.22%, 16.67, 25%, 20% and 14.29%, respectively. Forest, dense bushland and bareland showed 100% user’s accuracy indicating accurately automated classification was bush land carried out, whereas open bushland and farmland is less accurately classified (75%) in automated classification (Figure 3).
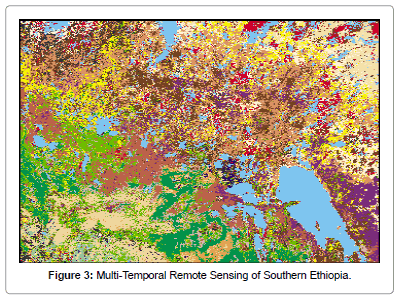
Figure 3: Multi-Temporal Remote Sensing of Southern Ethiopia.
| Classified data | Forest | Dense Bush land | Dense shrub land | Open bush land | Open Shrubs land | Grass land | Farm land | Bare land | Total |
|---|---|---|---|---|---|---|---|---|---|
| Forest | 2 | - | - | - | - | - | 2 | ||
| Dense bush land | - | 7 | - | - | - | - | - | 7 | |
| Dense shrub land | - | 5 | 1 | 1 | 7 | ||||
| Open bush land | - | 2 | - | 5 | - | - | - | 7 | |
| Open Shrubs land | - | - | - | 3 | - | - | - | 3 | |
| Grass land | - | - | - | - | 1 | 4 | - | - | 5 |
| Farm land | - | - | - | - | - | 4 | 1 | 5 | |
| Bare and | - | - | - | - | - | - | 6 | 6 | |
| Total observation | 2 | 9 | 5 | 6 | 4 | 5 | 4 | 7 | 42 |
Table 3: Error matrix of TM 2011 showing classification accuracy of the true landcover.
| Class Name | Reference total | Classified Total | No. of corrected | Producers Accuracy (%) | Users Accuracy (%) |
|---|---|---|---|---|---|
| Forest | 2 | 2 | 2 | 100 | 100 |
| Dense bush land | 9 | 7 | 7 | 77.78 | 100 |
| Open Shrubs land | 5 | 7 | 5 | 100 | 71.43 |
| Dense shrub land | 6 | 7 | 5 | 83.33 | 71.43 |
| Open bush land | 4 | 3 | 3 | 75 | 100 |
| Grass land | 5 | 5 | 4 | 80 | 80 |
| Farm land | 4 | 5 | 4 | 100 | 80 |
| Bare and | 7 | 6 | 6 | 85.71 | 100 |
| Totals | 42 | 42 | 36 | ||
| Over all accuracy (%) | 86.05 | ||||
| Over all kappa value | 0.84 | ||||
Table 4: The accuracy level of each Landcover category TM 2011.
Discussion
A wealth of information was retrieved on land use/land cover changes with the help of interpretation of satellite images of 1986 and 2011. Interpretation of images of these periods indicated the existence of considerable dynamics in the land use/land cover systems of the study areas. In both images (1986 and 2011), eight landuse classes were identified but most of the landuses either increased or decreased in size at different change rates in 2011, as compared to 1986.
The rates of land use/land cover changes varied between 1986 and 2011, with grassland, open shrubsland and bareland areas exhibiting a decrease, while all other landuse/landcover classes increased. Accordingly, grasscover contained the largest landuse/cover pattern in 1986, but thereafter showed a significant decrease in the study area. Moreover, (Table 1) indicates that about (28%) of the study area was covered by grassland before twenty five years but in 2011 it was reduced to18%. The decrease in grasscover could be associated with a steady increase in the other landuse/cover patterns such as bush and shrub cover land. As a result, an increase in bush and shrub cover has been reported elsewhere in response to heavy grazing in rangelands [8]. This will have a significant effect on ecology and socio-economic condition of the area and the consequences of the trends in land use/cover are far reaching.
Grasslands have been the main source of feed for livestock especially cattle in the area. The progressive reduction of grasscover may put serious constraints on animal feed and their productivity. Therefore, the relative increase in cultivated land could be a response to this problem in order to secure the required food demand of the society. This in turn could result in severe soil degradation, as has been shown in the expansion of barelands of the present study areas.
The area of open bush land, dense bush land and dense shrub land showed an increasing pattern over analysis period. Open bush land increased from 24% in 1986 32% in 2011 and dense bushland from 12% to 17% and dense shrubland from 9% to 13%. In general, the overall increase in land covered by bush and dense shrubland might be attributed to a number of factors like overgrazing, drought, and ban on the use of fire [9].
The major landuse/landcover changes within the Dire District were the results of the dynamic nature of bush encroachment, which is critically expanding and an issue of concern for the local communities. Bush encroachment has an adverse effect on the ecosystem and the environment. Herbaceous biomass production and bush encroachment are negatively correlated [17]. The expansion of unpalatable woody species significantly reduced the rangeland size and availability of grasses. The consequence of the decrease in herbaceous biomass production might result in high risk of food insecurity in the area. In addition, the bush prohibits access of livestock to the underlying grasses and as the canopy closes the grasses and herbs disappear letting the ground susceptible to water erosion. Furthermore, Gemedo Dalle et al. [17] recommended the re-introduction of fire as a rangeland management tool and selective clearing of encroaching woody plants could help reclaim degraded rangelands of Borena.
The current study has also revealed a slight increase in the spatial extent of farmland from 0.05% (2.11 km2) in 1986 to 0.2% (6.6 km2) in 2011, in order to meet the increasing demands caused by human population growth. Areas under forest and bareland remain more or less stable and not showing remarkable change during the study period. Forest showed slight increase from 3.4 km2 to 4.2 km2 , while bareland areas decreased from (24.5 km2 to 23.7 km2 , which might be related to the increasing pattern of land covered bush and shrubs that hide the visibility of the land from the air.
The result of the present study is similar in the direction of change with Borghesio and Gainnetti [18] in which the study undertaken on Bush crow (Z. stresemanni) in Yabello Sanctuary and its immediate surroundings, south to the town of Mega showed 8% increase in dense bush cover between 1986 and 2002. The result is also in agreement with the study reported by Sintayehu Mesele [19] in Yabello district. According to this study, grassland cover declined by about 149 km2 over 30 years, while that of bushland, bushed grasslands, and croplands (maize) increased.
Conclusion
Dire rangelands had faced a significant decrease in grass land and open shrub land cover since 1986s; associated with a significant increase in all the other recognized land use/cover systems. This might have generally resulted in the deterioration of the ecosystem such as increasing the area prone to soil erosion and destruction of original grasses. On the other hand, it was not only coverage of grassland that decreased but also desirable vegetations species types might have been destroyed (e.g. increase in bush encroachment). This directly decreased the productivity and carrying capacity of the area and negatively affected the yield of grasses which in turn suppressed the productivity of livestock particularly sheep and cattle as they do not prefer bush grazing. As a result, local communities shifted to a change in landuse pattern (e.g. expansion of cultivated land and/or rearing of more drought resistance animals. These latter activities could further drive ecological disturbance to irreversible conditions that might result in high risk of food insecurity in the area unless proper interventions are made in time.
Acknowledgement
We are grateful to the Department of Earth Sciences, Addis Ababa University and Oromia Water Works Design and Supervision Enterprise (OWWDSE), for providing funds and facilities for the field work.
References
- Manson SM (2005) Agent-based modeling and genetic programming for modeling land change in the Southern Yucatán Peninsular Region of Mexico. AgrEcosyst Environ111: 47-62.
- Steve NG, Nicholas CC, Michael AW, Sarah EG (2008) Multi temporal remote sensing of landscape dynamics and pattern change: describing natural and anthropogenic trends. Progress in Phys Geography 32: 503-528.
- Lillesand TM, Kiefer RW, Chipman JW (2004) Remote Sensing and Image Interpretation. (5thedn) John Wiley, New York.
- Geist H (2006) Our Earth’s Changing Land: An Encyclo- pedia of Land-Use/Land- Cover Change. Volume 1, Greenwood Publishing House, West Port, London.
- Singh A (1989) Digital change detection techniques using remotely sensed data. IntJ Remote Sensing10: 989–1003.
- Yang X, Zhang K, Jia B, Ci L (2005) Desertification assessment in China: An overview. J Arid Environ 63: 517-531.
- Palmer AR, Fortescue A (2003) Remote Sensing and Change Detection in Rangelands. African J Range Forage Sci 21: 123-128.
- Coppock L (1994) TheBorana Plateau of Southern Ethiopia: Synthesis of Pastoral Development and Change, 1980-91. Addis Ababa, Ethiopia.
- Angassa A (2007) The Dynamics of Savanna Ecosystems and Management in Borena Southern Ethioipia. PhD Thesis in Environmental and Development Studies, Noragic, Norwegian University of Life Sciences (UMB), Norway.
- Angassa A, Oba G (2007) Effects of management and time on mechanisms of bush encroachment in Southern Ethiopia. African J Ecol 46: 186-196.
- UN-OCHA (2008) Situation Report: Extended Dry Season in Borena Zone. UN-OCHA, Addis Ababa, Ethiopia.
- Giri C, Zhu Z, Reed B (2007)A comparative analysis of the Global Land Cover 2000 and MODIS land cover data sets. Remote Sens Environ 94: 123-132.
- Melesse AM (2004) Spatiotemporal dynamics of land surface parametres in the Red River of the North Basin. PhysChem Earth 29: 795-810.
- Burnnett C, Fall A,Temppo E, Kalliola R (2003) Monitoring current status of and trends in borealforest land use in Russian Karelia. Conserv Ecol7: 8.
- BLPDP (2004) Borana Low Land Pastoralist Development Program Documentation on Seven Years of Field Experience, Volume I: Overview of Borana Pastoral Production and Livelihood System. BLPDP. Addis Ababa, Ethiopia.
- Gemedo D, Mass BL, Isselstein J (2005) Plant Communities and their Species Diversity in the Semi-Arid Rangelands of Borana Lowlands, Southern Oromia, Ethiopia.Community ecol 6: 167-176.
- Gemedo D, Maass BL, Isselstein J (2006) Rangeland condition and trend in the semiarid Borana lowlands, southern Oromia, Ethiopia. African J Range ForageSci23: 49-58.
- Borghesio L, Giannetti F (2005) Habitat Degradation Threatens the Survival of the Ethiopian Bush Crow Zavattariornisstresemanni. African J Ecol 39: 44-49.
- Mesele S (2007) “Land Use Dynamics and its Impact on Selected Physicochemical Properties of Soils in YabelloWoreda of Borana Lowlands, Southern Ethiopia”. Unpublished MSc Thesis, Haramaya University.
Citation: Keno B, Suryabhagavan KV (2014) Multi-Temporal Remote Sensing of Landscape Dynamics and Pattern Changes in Dire District, Southern, Ethiopia. J Earth Sci Clim Change 5: 226. Doi: 10.4172/2157-7617.1000226
Copyright: ©2014 Keno B, et al. This is an open-access article distributed under the terms of the Creative Commons Attribution License, which permits unrestricted use, distribution, and reproduction in any medium, provided the original author and source are credited.
Share This Article
Open Access Journals
Article Tools
Article Usage
- Total views: 14640
- [From(publication date): 11-2014 - Apr 24, 2024]
- Breakdown by view type
- HTML page views: 10204
- PDF downloads: 4436