Using Hyperspectral Data to Identify Crops in a Cultivated Agricultural Landscape-A Case Study of Taita Hills, Kenya
Received: 11-Aug-2014 / Accepted Date: 30-Oct-2014 / Published Date: 10-Nov-2014 DOI: 10.4172/2157-7617.1000232
Abstract
Recent advances in hyperspectral remote sensing techniques and technologies allow us to more accurately identify larger range of crop species from airborne measurements. This study employs hyperspectral AISA Eagle VNIR imagery acquired with 9 nm spectral and 0.6 m spatial resolutions over a spectral range of 400 nm to 1000 nm. The area of study is the Taita hills in Kenya. Various crops are grown in this region basically for food and as an economic activity. The crops addressed are: maize, bananas, avocados, and sugarcane and mango trees. The main objectives of this study were to study what crop species can be distinguished from the cultivated population crops in the agricultural landscape and what feature space discriminates most effectively the spectral signatures of different species. Spectral Angle Mapper (SAM) algorithm together with some dissimilarity concepts was applied in this work. The spectral signatures for crops were collected using accurate field plot maps. Accuracy assessment was done using independent training vector data. We achieved an overall accuracy of 77% with a kappa value of 0.67. Various crops in different locations were identified and shown.
Keywords: Hyperspectral imaging; Spectral signatures; Spectral variation; Crop identification; Spectral angle mapper
Introduction
Hyperspectral remote sensing data can provide a significant spectral measurement capability over the conventional remote sensor systems and hence becomes very useful in identification and modelling of terrestrial ecosystem characteristics. Not long ago, mapping was mainly using satellite (space borne) data for large area mapping but for small regions, it used aerial images (air borne) and in most cases, the result was just a land cover map combining several classes of pixels having some broad similarity. The need to discriminate crop species to know their health, location and distribution has paved way in this decade due to available sensors which can detect at high spatial and spectral resolutions the natural and man-made features on the surface of the earth. The advancement not only on the sensor availability but also the technology used to discriminate the various spectra of different species has become a boost to mapping. Many technologies have been used for extracting terrestrial features from hyperspectral imagery. Principal Component Analysis (PCA) among other algorithms for crop classification has yielded good results [1]. Step-wise Discriminant Analysis (SDA) and Derivative Greenish Vegetation Indices (DGVI) to classify and characterize both vegetation and agricultural crops have been used [2,3]. Dissimilarity based approaches have also given good representation of hyperspectral data [4]. Tree species identification has been one area of interests for scientist dealing with forests and vegetation mapping. Statistical methods to identify tree species in forests have shown good and accurate results. Nevertheless, Artificial Neural Networks (ANN) and Linear Discriminant Analysis (LDA) have given reliable results in tree species identification.
Some other approaches in coastal environments have been made to identify mangrove species using both object-based and pixel-based classification methods. A comparison has been given and in this regard, results indicate that object based mapping approach is better than pixelbased approach with a difference of just about 7% overall accuracy and 0.1 kappa [5]. All these shows that crop species can be discriminated in a similar if not a different but close approach. The objectives of this study were (1) to examine the capability of hyperspectral data to distinguish selected crops in a cultivated agricultural landscape in the Taita hills in Kenya, (2) to evaluate the spectral angle divergence of various crops and use this to discriminate the crop species and (3) to assess the accuracy of the classification.
Study Area
Taita Hills, (03°20’S, 38°15’E) in Kenya are one of the biodiversity hot spot in Eastern Africa. A wide range of studies have been made recently in this area for instance; on land use, land degradation, soil erosion, biodiversity, urban growth and sacred forest remnants. The area is facing a population growth and intensification of agriculture, which is the major economic activity for the Taita community. Although the terrain varies from 600 m to about 2200 m.a.s.l, farmers cultivate various crops ranging from maize (Zea mays), bananas (Musa paradisiaca), fruits and even fodder crops for animals, which are normally put in zero-grazing system (Figure 1).
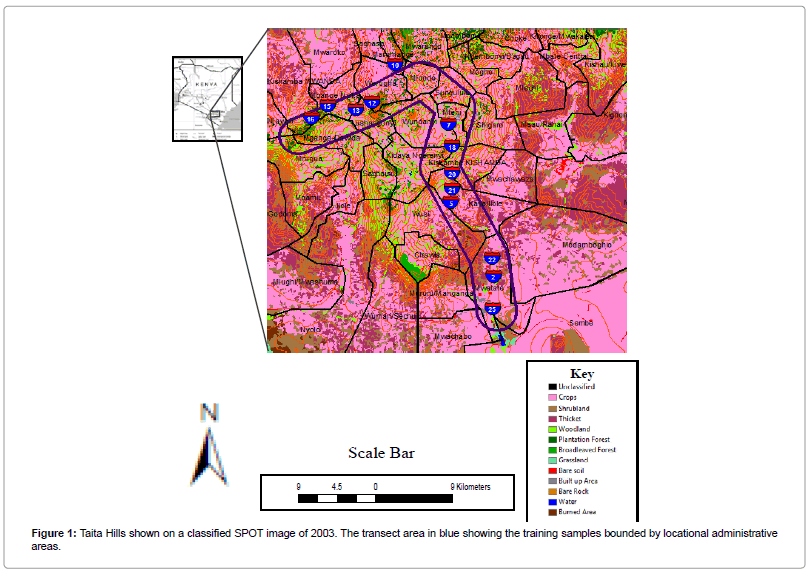
Figure 1: Taita Hills shown on a classified SPOT image of 2003. The transect area in blue showing the training samples bounded by locational administrative areas.
Hyperspectral data was collected using AISA Eagle VNIR sensor system. Its accuracy is ranging in the following domain: 9 nm and 0.6 m in both spectral and spatial resolutions respectively over a spectral range of 400 nm to 1000 nm. This gives 64 spectral bands. The fieldwork measurements were conducted simultaneously with hyperspectral data acquisition. The flying height was about 2,400 meters above sea level to maintain the spatial resolution of 0.6 m. Accurate photographs taken by the Nikon 3DX camera, which was attached together with the AISA sensor on board during the time of flight, were used to map every species in the selected plots. This data were used as ground truth and training data. Spectral signatures of crops are known to vary due to leaf optical properties, leaf angles and spatial distribution. Signatures also vary from leaf to canopy scales. The spatial resolution for this datasets was kept at 0.6 meters, which is more accurate in discriminating the various crops especially for areas such as maize plantations, banana farms, and large fruits trees such as mangoes and avocadoes. Eight sampled plots were geo-referenced in order to get exact location of the crops in the plots. A detailed aerial mosaic was used to overlay the geo-referenced maps onto it and training polygons with respect to the crops were on-screen digitized with ArcGIS 10 out of the maps. Small regions depicting the spectral patterns for the specified crop were then generated and saved as Regions of Interests (ROIs) and later used as endmembers [6,7].
Methodology and Analysis
The hyperspectral image collected was subjected for pre-processing. This catered for three distortions: radiometric, geometric and atmospheric effects. Radiometric corrected for sensor sensitivity, solar angle and topography. Geometric correction was basically applied to have a geometrically correct image. Digital elevation model at 20-meter resolution was resampled to 0.6 meter spatial resolution which conformed to the image spatial resolution. Atmospheric corrections were finally applied to remove the atmospheric effects. The image was checked using the z-profile tools and spectral reflectance on every cursor location of the image was checked. No distortion was evident. This procedure was conducted using the ATCOR-4 software which is specifically designed for correcting for atmospheric distortions.
For spectral extraction, 148 digitized polygons were used to derive endmembers for crop classification. They were extracted from the sampled plots. These comprised of maize (Zea mays), bananas (Musa paradisiaca), mangoes (Mangifera indica), avocados (Persea americana), sugarcane (Socharum spp.) and farm trees such as Cypress (Cupressus dupreziana), Grevillea (Grievillea robusta) among many others. They were further divided into two datasets so that about 30% of every class was reserved for accuracy assessment and 70% was used for classification. Theoretically, existing pure features in mixed pixels are referred to as endmembers and their collection describes all spectral variability for all pixels in a given image. Endmembers for this study were selected to enable mapping of the selected crops using Spectral Angle Mapper (SAM) algorithm of Envi software.
Figure 2 shows the spectral reflectance of the six-collected endmembers in different colors. Blue corresponds to maize plantations, cyan on the other hand corresponds to sugarcane whereas yellow is for mango trees. Magenta is representing agro-forestry, green for bananas and finally the avocados are represented by red color. Spectral Angle Mapper (SAM) is a physically-based spectral classification that uses an n-D angle to match pixels to reference spectra. It assumes that data have been reduced to apparent reflectance (true reflectance multiplied by some unknown gain factor controlled by topography and shadows). The algorithm determines the spectral similarity between two spectra by calculating the angle between them as vectors in a space with dimensionality equal to the number of bands (n). This technique, when used on calibrated reflectance data, is relatively insensitive to illumination and albedo effects. Endmember spectra used by SAM can come from ASCII files or spectral libraries, or one can extract them directly from an image (as ROI average spectra). SAM compares the angle between the endmember spectrum vector and each pixel vector in n-D space. Smaller angles represent closer matches to the reference spectrum. The result is a classification image showing the best match. Pixels further away than the specified maximum angle threshold in radians are not classified [8-10]. SAM was used to classify the selected crop species in Taita hills. The spectral angle of dissimilarity was kept at 0.1 radians (Table 1).
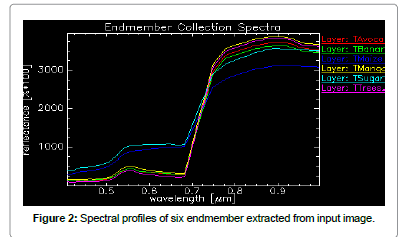
Figure 2: Spectral profiles of six endmember extracted from input image.
| Classes | Classification | Accuracy Assessment | Total |
|---|---|---|---|
| Bananas | 12 | 3 | 15 |
| Trees | 5 | 2 | 7 |
| Mangoes | 39 | 9 | 48 |
| Sugarcane | 5 | 2 | 7 |
| Avocado | 39 | 8 | 47 |
| Maize | 18 | 6 | 24 |
Table 1: Number of samples used for classification and accuracy assessment.
Results
Spectral map relates to the spectrum that is generated from the end members selected. After classification, the classified map was linked to the color infra-red image that was used to extract the spectra. A visual analysis was done. Most of the features were classified such as maize plantations, trees and sugarcane. The color representation of the data was similar to the color scheme in Figure 3. Accuracy assessment gave an overall accuracy of 77% and kappa of 0.67. Table 2 shows the contingency matrix. The values are the number of pixels classified in every class from the total pixels that were used in the classification process.
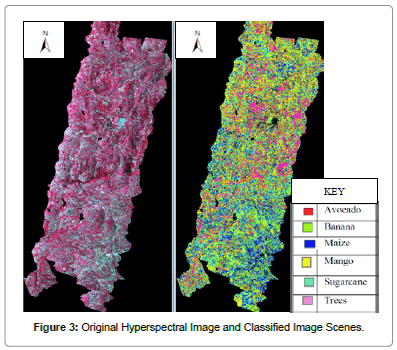
Figure 3: Original Hyperspectral Image and Classified Image Scenes.
| Reference (Polygons) | ||||||||
|---|---|---|---|---|---|---|---|---|
| Classified | Others | Trees | Avocado | Banana | Maize | Mango | Sugar | Total |
| Map | ||||||||
| Others | 78 | 0 | 0 | 0 | 0 | 0 | 0 | 78 |
| Trees | 0 | 0 | 6 | 2 | 0 | 0 | 0 | 8 |
| Avocado | 0 | 1 | 0 | 3 | 0 | 0 | 0 | 5 |
| Banana | 0 | 1 | 0 | 4 | 0 | 3 | 0 | 8 |
| Maize | 0 | 0 | 0 | 0 | 5 | 0 | 5 | 10 |
| Mango | 0 | 3 | 1 | 0 | 0 | 23 | 0 | 26 |
| Sugar | 0 | 0 | 0 | 0 | 4 | 2 | 7 | 13 |
| Total | 78 | 5 | 7 | 9 | 9 | 28 | 12 | 148 |
Table 2: Confusion matrix of the classification
Many pixels though are seen to be unclassified, indicated on the Table 2 as others. Producer's and user's accuracies were also tabulated, (Table 3). The trees and avocadoes were poorly classified in the final map. Trees had some similar spectra to some crops, and the major crop here was the avocado. This ended up with a misclassification of avocado species for trees. The selection of tree samples was achieved from forest patches from aerial mosaic in which there exists various species of trees however the training samples were very few (Figure 4).
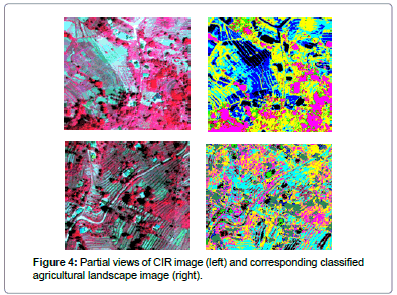
Figure 4: Partial views of CIR image (left) and corresponding classified agricultural landscape image (right).
There is a high correlation between the producer of the classification and the user of the classified map in that the difference between them is less than 10 percent.
Discussion
Crop type classification indicates that it is possible to discriminate various crops using AISA Eagle VNIR data and the spectral angle mapper (SAM) algorithm in a cultivated landscape. The confusion matrix shows that most classes were classified to be trees due to the spectral angle between them being as closest. Bananas, avocadoes, mangoes and trees (call this cluster 1) had very similar profile. A distinction between maize and sugarcane (call this cluster 2) is much better than that of cluster 1. Spectral range between 500 nm to 700 nm can be seen to separate not only the two clusters but also the different crop types. The unclassified pixels (others) constituted mainly reflective natural and man-made features such as buildings, roads and water bodies. These were not considered for endmember selection but the pixels are part of the input image for classification. Table 3 shows the producer's and user's accuracies. Mangoes, sugarcane, maize and bananas had good producer's and user's accuracies. Avocadoes were poorly classified even though it was the class with most endmembers (Table 1). The reason could be linked to their close reflectance with other trees. One disadvantage endured in this study is the limitation to distinguish the trees in a cultivated crop land. Trees here were summation of several species from the agro-forestry areas. It can be argued that just as crops differ in their reflectance from crop to crop, it is also true that there's a reflectance difference between tree to tree and that crop types such as mangoes and avocadoes are also trees in their nature. In identifying crop types in a cultivation landscape, it is wise to identify various tree species within the agro-forestry environment too.
| Classes | Producer's | User's |
|---|---|---|
| Trees | 0.50% | 0.30% |
| Avocadoes | 6.80% | 8.40% |
| Bananas | 49% | 43.20% |
| Maize | 50.10% | 42.80% |
| Mangoes | 78.70% | 87.30% |
| Sugarcane | 52.40% | 49.60% |
| Others | 99.90% | 99.40% |
Table 3: Producer's and user's accuracies.
Conclusions
Classification of crop types is possible using AISA Eagle VNIR data and spectral angle mapper algorithm. This study focused entirely on sampled field plots (polygons mapped from plots with respect to each crop represented therein) and spectral signatures extracted from the input airborne hyperspectral image to map out selected crops. Many studies have shown good results with this method although object based approach instead of pixel - based could yield a more accurate result.
Acknowledgements
The first author would like to acknowledge Dr. Janne Heiskanen and Mr. Pekka Hurskainen for their support during data collection, encouragement, constructive ideas and directions given to improve the quality of this manuscript. Thanks also to Mr. Rami Piiroinen and Mr. Tuure Takala, for their guidance on the pre-processing of the hyperspectral imagery. Authors also acknowledge the support from Mr. Alain Sylla and Mr. Samuel Nthuni in matters that related to GIS. Many thanks to the CHIESA project for funding this work.
References
- Mader S, Vohland M, Jarmer MT, Casper M (2006) Crop Classification with Hyperspectral Data of Hymap Sensor Using Different Feature Extraction Techniques. The 7th SIG-Imaging Spectroscopy Workshop, EARSeL Edinburgh, UK.
- Thenkabail PS, Eden A, Mark SA, Van Der Meer B (2004) Accuracy Assessments of Hyperspectral Waveband Performance for Vegetation Analysis Applications. J Remote Sens Environ 91: 354-376.
- Thenkabail PS, Smith RB, De-Pauw E (2000) Hyperspectral Vegetation Indices for Determining Agricultural Crop Characteristics. J Remote Sens Environ 71: 158-182.
- Paclik P, Duin RPW (2002) Dissimilarity based classification of spectra: Computational issues. Real Time Imaging 9: 237-244.
- Kamal M, Phinn S (2011) Hyperspectral Data for Mangrove Species mapping: A comparison of Pixel-Based and Object-Based Approach. J Remote Sens 3: 2222-2242.
- Ashoori H (2008) Evaluation of the usefulness of texture measures for crop type classification by hyperion data, The International Archives of the Photogrammetry, Remote Sensing and Spatial Information Sciences, University of Technology, Tehran - Iran.
- Clark LM, Roberts DA, Clark BD (2005) Hyperspectral discrimination of tropical rain forest tree species at leaf to crown scales. J Remote Sens Environ 96: 375-398.
- Congalton RG (1991) A Review of Assessing the Accuracy of Classification of Remotely Sensed Data. J Remote Sens Environ 37: 35-46.
- Galvao LS, Formaggio AR, Tisot DA (2005) Discrimination of Sugarcane Varieties in Southeastern Brazil with EO-1 Hyperion data. J Remote Sens Environ 94: 523-534.
- Rama RN, Garg PK, Ghosh SK (2007) Development of an Agricultural Crops Spectral Library and Classification at Cultivar Level using Hyperspectral Data. J Precis Agr 8: 173-185.
Citation: Boitt M, Ndegwa C, Pellikka P (2014) Using Hyperspectral Data to Identify Crops in a Cultivated Agricultural Landscape-A Case Study of Taita Hills, Kenya. J Earth Sci Clim Change 5: 232. Doi: 10.4172/2157-7617.1000232
Copyright: ©2014 Boitt M, et al. This is an open-access article distributed under the terms of the Creative Commons Attribution License, which permits unrestricted use, distribution, and reproduction in any medium, provided the original author and source are credited.
Share This Article
Open Access Journals
Article Tools
Article Usage
- Total views: 16153
- [From(publication date): 11-2014 - Apr 25, 2024]
- Breakdown by view type
- HTML page views: 11544
- PDF downloads: 4609