 |
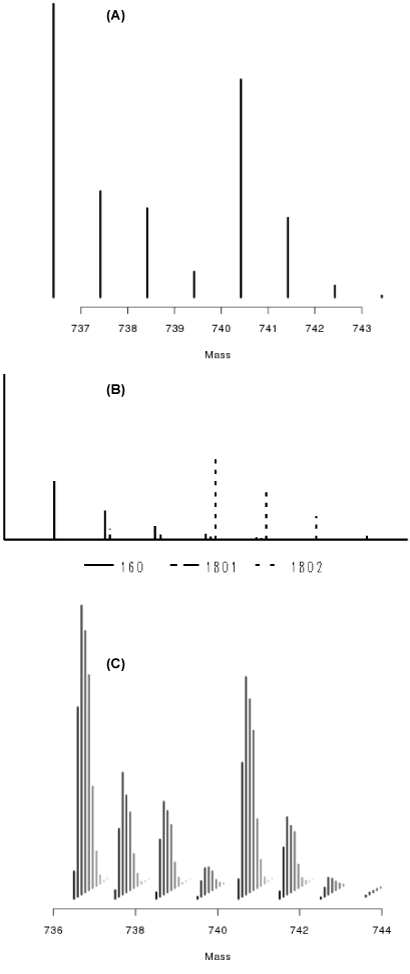
| Figure 1: (A) An example of an observed joint isotopic cluster of 16O/18Olabeled peaks using 90% enriched H218O that was detected in a single elution time spectrum from a pair of samples with an expected 1:1 ratio. (B) An illustration of how the 16O/18O joint isotopic cluster shown in (A) is comprised of three overlapping sets of isotopic clusters. (C) The full elution profile for the molecular species displayed in (A). |