|
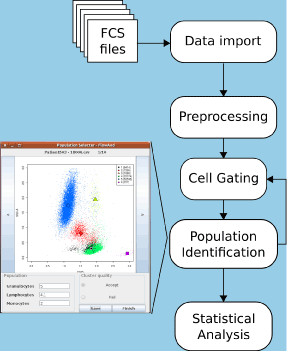
| Figure 1: FlowAnd overview: An overview figure of the steps in a full analysis of flow cytometry data. First data are preprocessed by applying compensation and a transformation to the data. Next the cells are filtered by clustering and selecting debris clusters out from the data. The third step is to identify cell populations from the data and this is done by first clustering the data and then applying a rule based method to label the clusters into populations. Finally once the correct populations have been identified, the data can be summarized in a report. |