 |
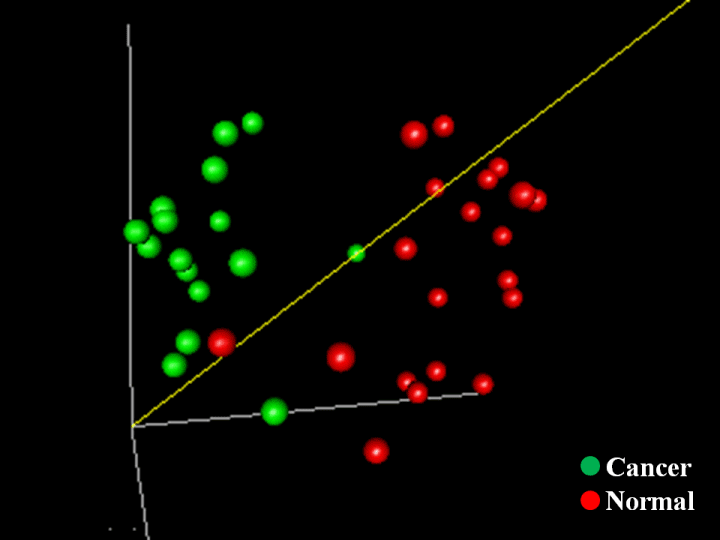
| Figure 3: A principal component analysis (PCA) plot for papillary thyroid carcinoma (shown in green) and adjacent normal (shown in red) samples, based on the lipid MALDI MS profiles (‘1-correlation distances among samples’ as the distance metric). Samples whose lipid MALDI profiles are very similar are shown close together. |