 |
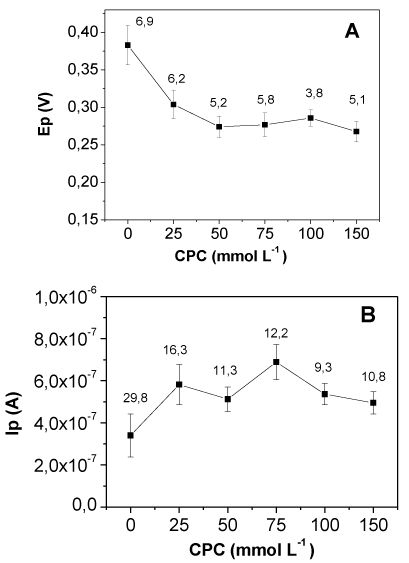
| Figure 2: Variation of the peak potential Ep (A) and peak current Ip (B) in serum (diluted in PBS 1:4) with surfactant concentrations. (pH 7.4). The values are mean ± SD of 20 voltammograms for each CPC concentration. The numbers indicate the variation coefficients (%) after 20 measurements for each concentration. |