 |
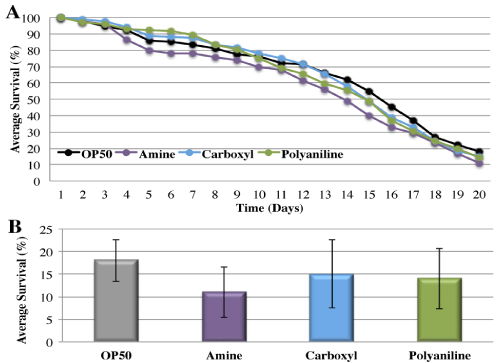
| Figure 2: Coated-MNPs do not correlate with an impact on C. elegans longevity. (A) Longevity curves; (B) mean longevity. Each graph is the representative average of 3 different trials, n=100 worms per group. Error bars represent the standard deviation of the average. |