|
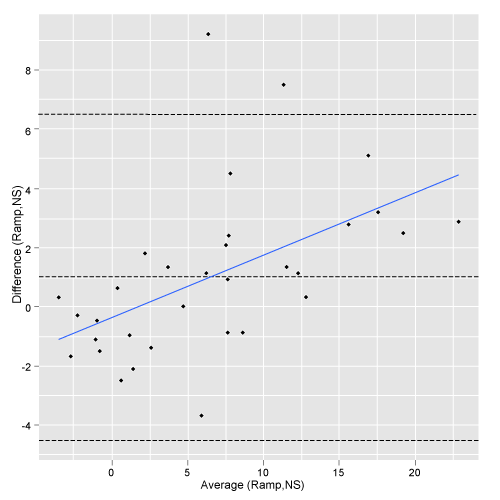
| Figure 3: A Bland-Altman difference plot of the MD of the pulsed RAMP strategy and the NS for all subjects. On the X-axis the difference between the MDs of the pulsed RAMP and the NS is plotted against the averages of the two methods on the y-axis. Horizontal dotted lines are drawn at the mean difference, and at the limits of agreement, which are defined as the mean difference ± 2.0 times the standard deviation of the differences. The blue line indicates the regression line, showing a possible trend: the MDs of the pulsed RAMP tend to be higher in cases with advanced visual field defects and lower in control patients. |