|
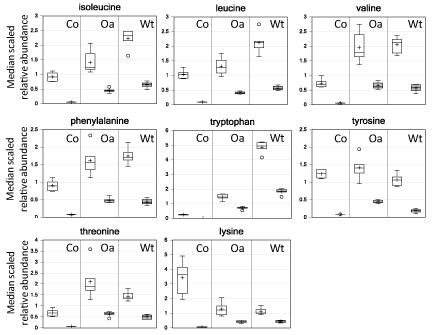
| Figure 7: Boxplots of selected amino acids. Co, corn; Oa, oat; Wt, wheat. Open box, whole grain; shaded box, bran fraction. The boxed area represent the interquartile range; whiskers indicate maximum and minimum values; the horizontal line indicates median value; “+” indicates mean value. |