 |
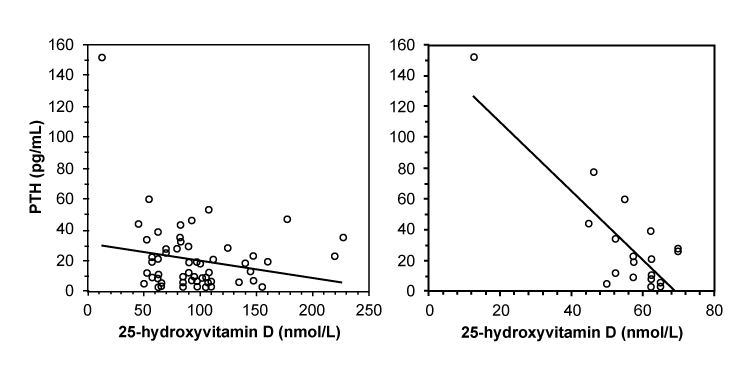
| Figure 3: Correlation between PTH and 25-hydroxyvitamin D.Circles show the individual data points and the line shows the least-squares line. Left panel, in all subjects. There is no correlation betweenUca/Ucrand 25-hydroxyvitamin D (n=58, r2=0.078, p is ns). Right panel, subjects with 25-hydroxyvitamin D <80 nmol/L. Here, there is significant correlation (n=17, r2=0.469, p< 0.005). The outlier in both panels was the subject found to have biochemical rickets. |