 |
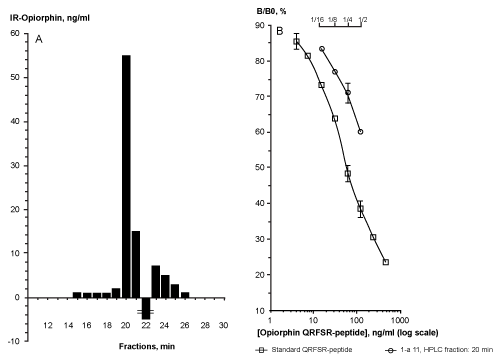
| Figure 1: Analyses of human plasma by RP-HPLC and ELISA-Opiorphin. A. HPLC chromatography in tandem with ELISA-opiorphin detection of individual plasma extract. The plasma sample was extracted using a C18 solid-phase extraction procedure before loading onto a C18-ACE-HPLC column. After lyophilization each 1 min fraction was analyzed by ELISA-Opiorphin and the results expressed as concentration of immunoreactive (IR) opiorphin in ng/ml (Y axis) by HPLCfraction in min (X axis). B. Analysis of individual purified plasma sample using ELISA-Opiorphin method. Standard curve (open squares) relating QRFSR-peptide concentration in ng/ml (log scale, X axis) to the percentage of binding in the presence (B) of standard peptide / binding in the absence (B0) of the standard peptide (linear scale, Y axis). Sample curve (open circles) relating serially diluted (2-fold) individual purified plasma sample to B/B0, % response. Note that there is a parallel between the dose-response standard curve and the serial dilutions of the sample. Each point represents the mean ± SD of duplicates. |