 |
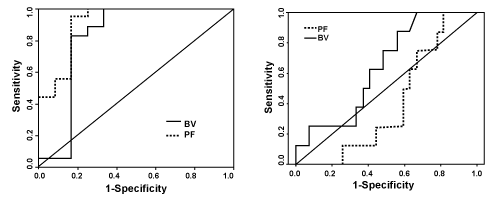
| Figure 4: (a) Grading of renal cell carcinoma with fatty infiltration, the area under the curve of PF and BV were 0.912 and 0.819, respectively; (b) Grading of renal cell carcinoma without fatty infiltration, the area under the curve of PF and BV were 0.403 and 0.641, respectively. |