|
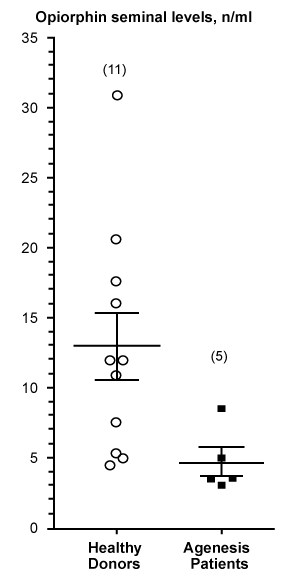
| Figure 4: Dot plot representations of semen opiorphin levels in healthy donors and CBAVD patients. Each individual opiorphin value is represented by an open circle for healthy donors (n=11) and by a black square for CBAVD patients (n=7). The mean ± SEM for both groups are represented. |