 |
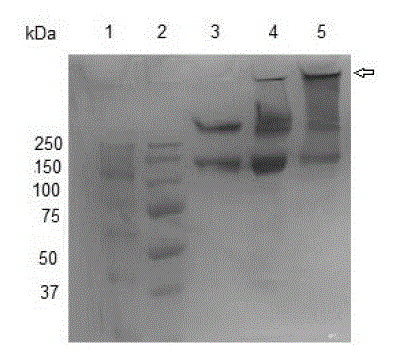
| Figure 4: 4-15% SDS-PAGE analysis of TC + BM (PEG)3 (Figure 3A, lane 6) under native condition. Toxin complex proteins were visualized by staining with Coomassie Blue R-250 stain. High molecular standard protein marker (lane 1), low molecular standard protein marker (lane 2), reduced toxin complex from Hall strain (lane 3); reduced toxin complex from PS 5 strain (lane 4) reduced toxin complex from PS 5 strain + BM (PEG)3 40 h (panel A; lane 6) was loaded in lane 5. |