 |
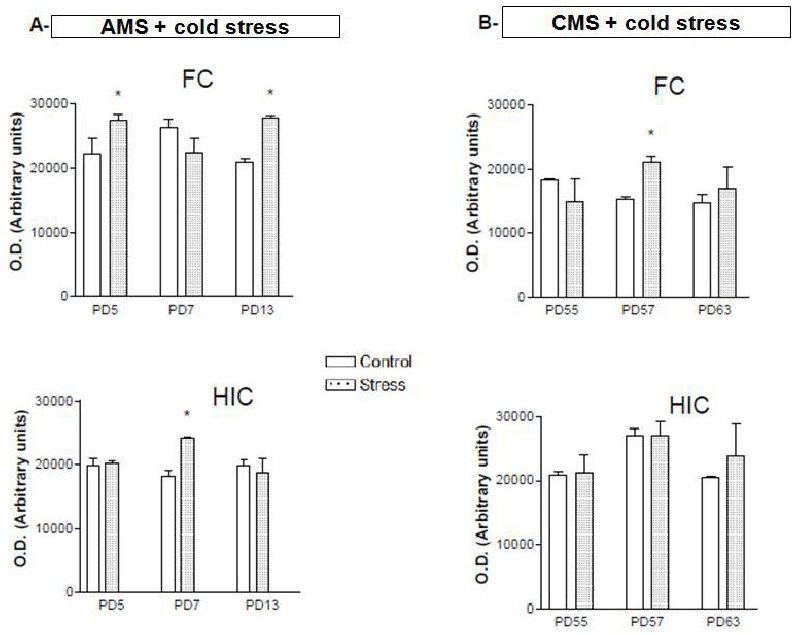
| Figure 1: Western blotting analysis of GLT1 (MW: ~ 52 kDa) in FC and Hic homogenates from A: unstressed group and AMS+cold stress group. B: unstressed group and CMS+cold stress group. Band densities were quantified and are shown as a bar chart. The expression level corresponds to the number of black pixels of each band counted using Image J, data are quoted as the mean ± SEM. Actin (MW: ~ 42 kDa) served as a loading control. GFAP (MW: 49 kDa) served as glial marker. Western blots are representative of 3 different experiments. OD:optical density, arbitrary units. *p<0.05; ** p<0.01 compared with the respectively unstressed group. |