 |
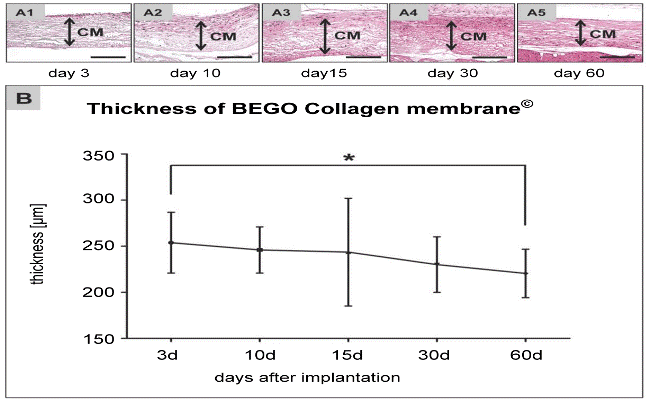
| Figure 6: Shows membranes integrity and histomorphometrical analysis of membranes thickness. A1-A5) show the collagen membrane profile (CM=double arrows) during the observation period (H& E-stainings, 200x magnification, scale bars = 100 μm). B) Shows the histmorphometrical analysis of membranes thickness from day 3 until day 60 after implantation (* = statistical significances). |