 |
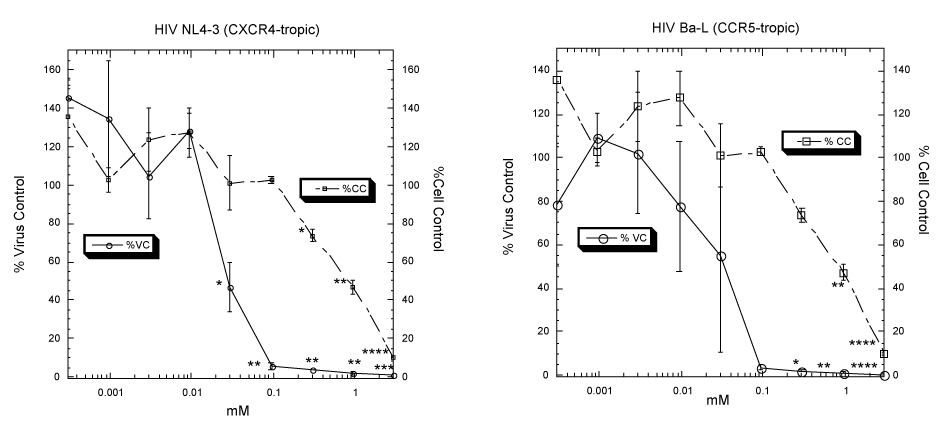
| Figure 1: Inhibition of HIV-1 replication by Cohex. Double-Y, semi-log plots are shown for the decrease in supernatant HIV-1 reverse transcriptase (RT) activity (left axes), as a measure of viral replicationfor HIV-1 isolates, or uninfected cell viability (right axes). Error bars for the figures are for standard error (SE) of the mean: a) CXCR4-tropic isolate b) CCR5-tropic isolate. Asterisks correspond to levels of significance relative to infected, no-compound control (%Virus Control) or uninfected, no-compound control (%Cell Control) (Studentís t-test, two-tailed, *p < 0.05, **p < 0.005, ***p < 0.0005). |