|
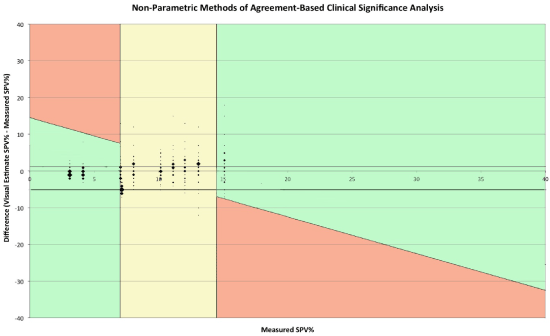
| Figure 3: The difference between estimated and actual Systolic Pressure Variation (SPV) is displayed against the actual SPV, using the non-parametric approach of agreement based on the clinical significance analysis [10]. The size of each data point represents the number of subjects who selected every single estimate. The color zones displayed in this figure are defined according to the definition from Thiele et al. in 2012 [2]. |