 |
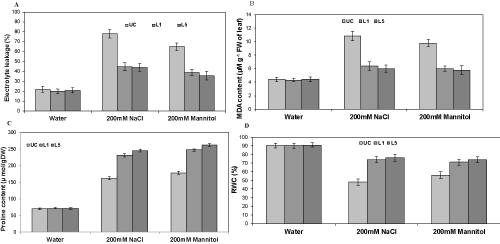
| Figure 3: Comparison of abiotic stress tolerance of transgenic expressing lectin gene and Un transformed Control (UC) Brassica juncea plants. (a) Changes in electrolyte leakage from Brassica juncea leaf tissue as a percentage of total electrolytes in the leaves (b) MDA content (c) Proline content and (d) Relative Water Content (RWC) content in UC and transgenic plants exposed to NaCl (200 mM) or mannitol (200 mM) stress. The plants irrigated with water served as the untreated control. Values are mean ±SD of three experiments (three replicates per experiment). Results are significant at P< 0.05. |