 |
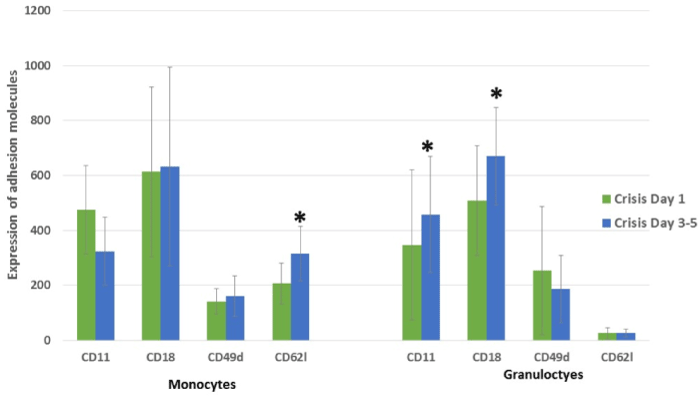
| Figure 2: Comparison of the expression of adhesion molecules on granulocytes and monocytes between day 1 and day 3-5 of the admission in crisis patients. Data are expressed as mean ± standard deviation of the mean fluorescence intensity. *P<0.05 compared to day 1. |