 |
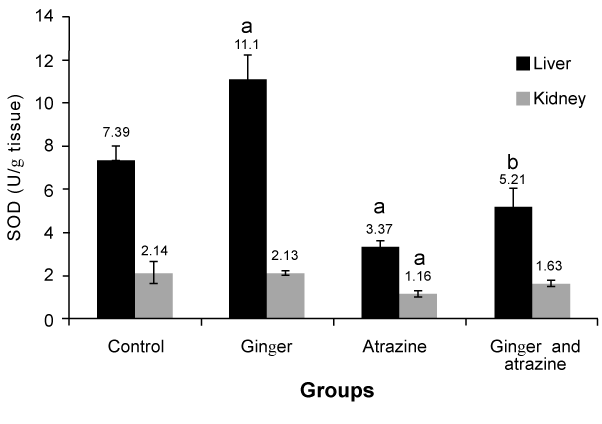
| Figure 5: Effect of atrazine and ginger on the SOD activities in liver. SOD activity was determined by measuring the absorbance at 480 nm. 10 Ál liver homogenate was used (see section 2.9) and activity was expressed as U min/g/ tissue. Values are expressed as mean ▒ SE (n=5). aSignificantely different from control P < 0.05. bSignificantly different from atrazine group P < 0.05. |