 |
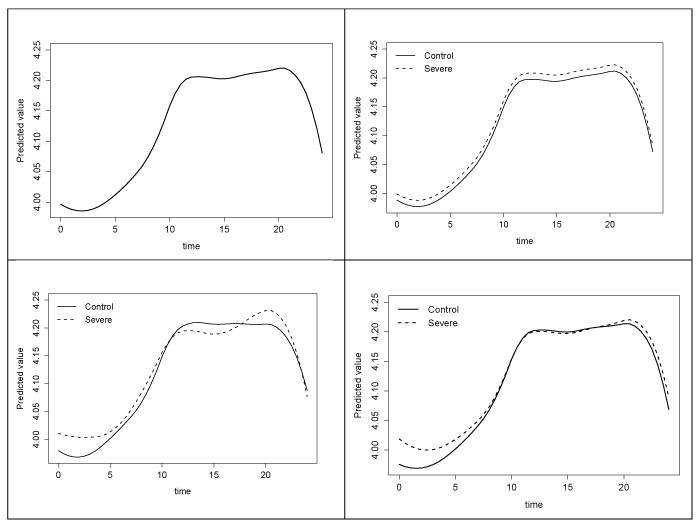
| Figure 2: Hypothesized differences between groups for semiparametric mixed models applied to the diastolic blood pressure (DBP) data. Beginning clockwise from the upper left panel, smooth function obtained from model assuming a common profile (Model 1.1); smooth functions with parallel group differences over time (Model 1.2); distinct quadratic trends (Model 1.3); different smoothing on functions via distinct spline coefficient vectors for the groups (Model 1.4). |