 |
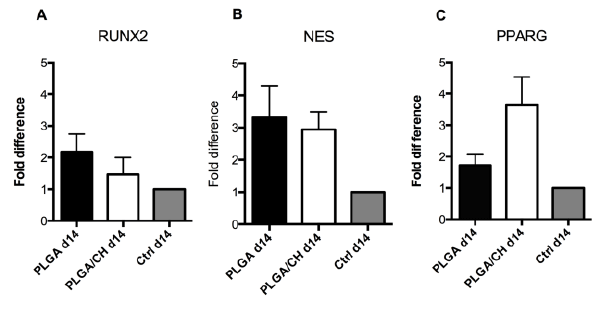
| Figure 6:Genetic profile of MSC grown on PLGA and PLGA/CH on day14 (n=3). MSC grown on PLGA and PLGA/CH were analyzed by quantitative PCR for genetic markers in (A) bone (RUNX2): mean-fold difference, PLGA, 2.17; PLGA/CH, 1.46; (B) neurological marker (NES): mean-fold difference, PLGA, 3.33; PLGA/CH, 2.94; and (C) fat (PPARG): mean-fold difference, PLGA, 1.72; PLGA/CH, 3,63, when each was compared to MSC grown on tissue-culture plastic. |