 |
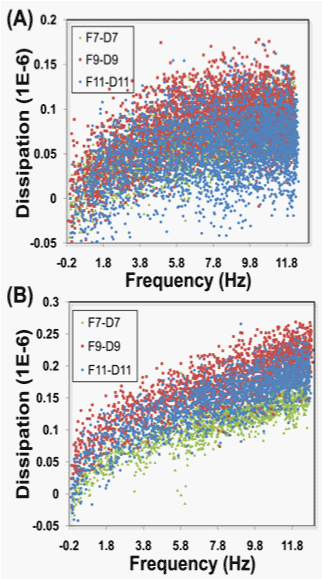
| Figure 3: ΔD - Δf plot for TNT at 1μg/mL (A) and TNB at 10μg/mL (B). Colored points represent different overtones of frequency in QCM measurement. The slopes are obtained from the trend lines of these points. And the difference in slopes distinguishes TNT from its analogs. |