|
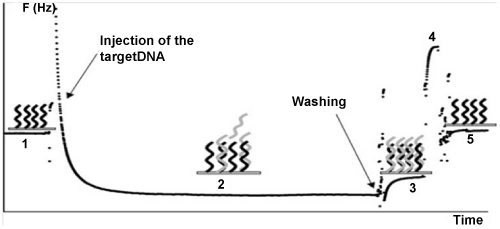
| Figure 1: Frequency variations during a hybridisation reaction taking place on the surface of the crystal. The analytical signal is taken as frequency difference between value at point 1 and 3. (1) Free probe; (2) DNA target comes into contact with the free probe; (3) hybridized probe; (4) regenerating agent; and (5) free probe [11]. |