 |
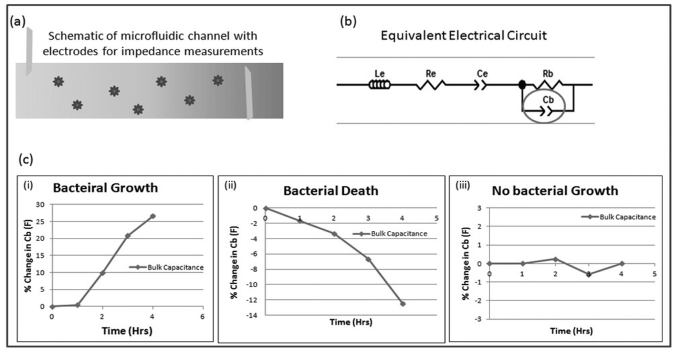
| Figure 1: (a) Gives the schematic representation of the suspension of bacteria in media inside the micro-channel in contact with the metal electrodes (b) Equivalent circuit used to model the electrical behavior of the same. The circuit represents the Inductance (Le), Resistance (Re) and the Capacitance (Ce) at the electrodes along with the Resistance (Rb) and Capacitance (Cb) of the bulk of the suspension containing bacteria (c) Gives the typical plots of the Cb values (obtained after fitting the data to the equivalent circuit in (b)) as a function of time where (i) indicates no change in bulk capacitance values as the bacteria does not grow over time (ii) indicates the increase in the value of bulk capacitance as bacterial concentration increases (iii) indicates a decrease in the bulk capacitance values as bacterial concentration decreases over time. |