|
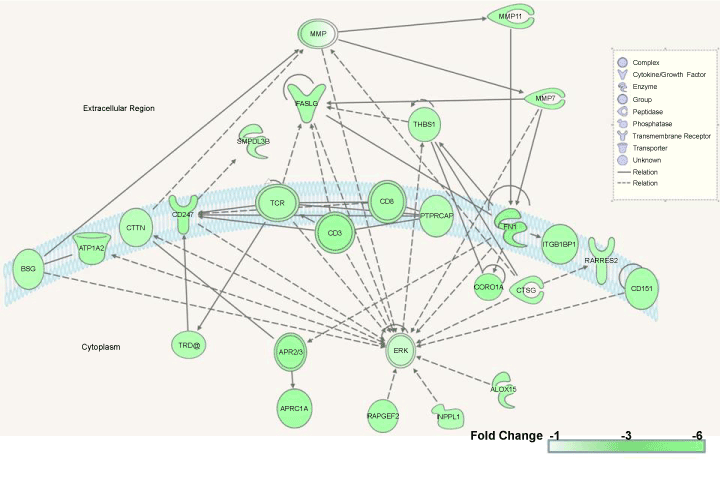
| Figure 5: Regulatory network for matrix metallopeptidases, T-cell receptors, and their downstream signal transducers. The nodes and networks are distributed between the extra- and intercellular regions and the interfaces (not drawn to scale). Green-colored genes are significantly suppressed at all time points after the B. anthracis spore exposure compared to the control cells (a color scale is at the bottom right corner). The nodes represent the genes or proteins (see the legend for detail); and the solid and dashed arrow-headed lines depict the direct and indirect interactions, respectively. |