|
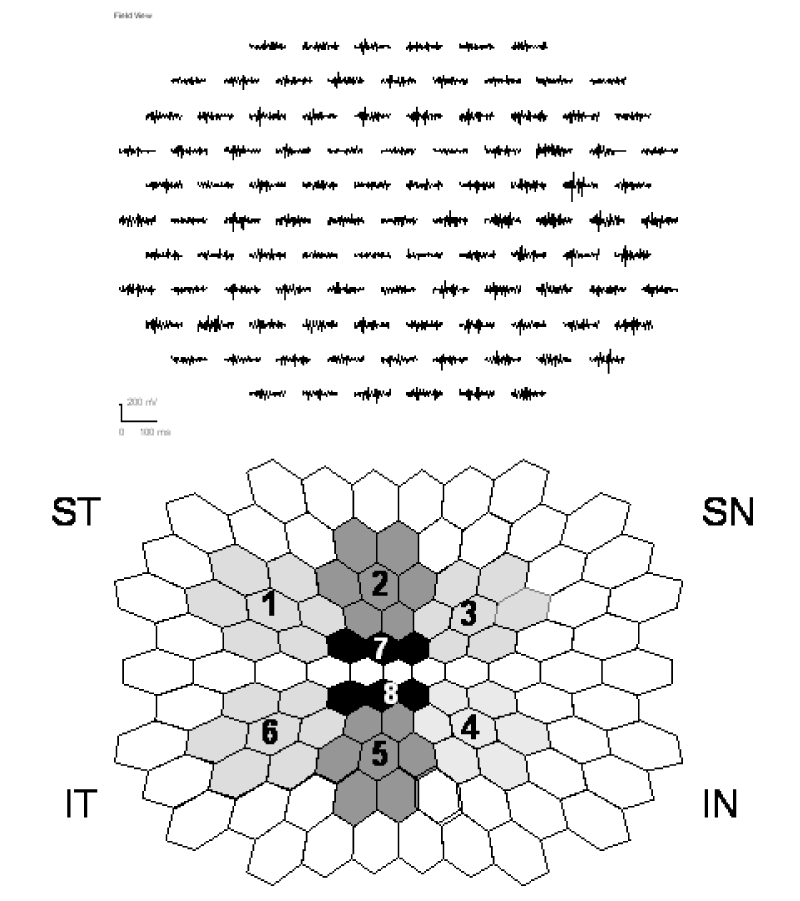
| Figure 2: Figure 2 top depicts an example of the OPs (field view) obtained from the left eye of a control subject. The lower part of figure 2 shows the areas over which the focal SP values were averaged to form 8 response averages- in this example also for a left eye. |