 |
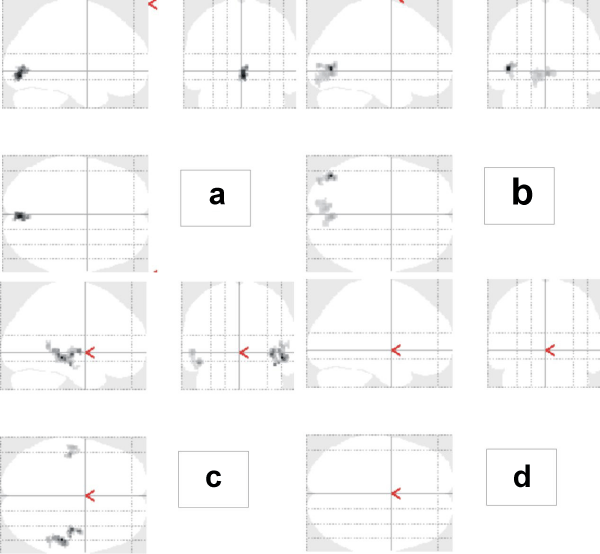
| Figure 2: Shows regions which are activated more significantly during the BW stimulation (top - a, b) and inversely, during the YB stimulation (bottom - c, d). The left column represents results in the controls (a, c) and the right column shows the patients (b, c). |