 |
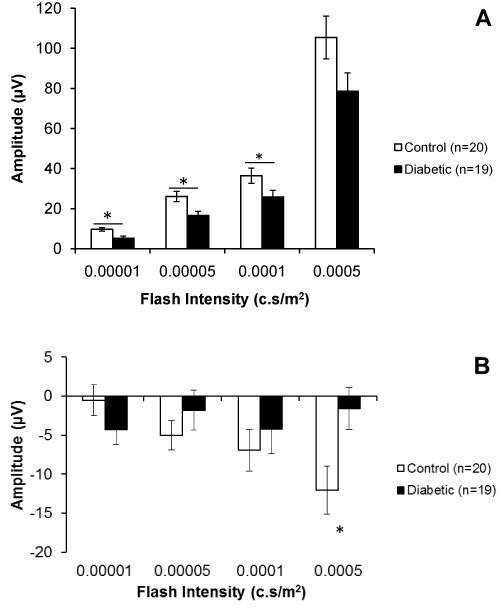
| Figure 1: Positive scotopic threshold response for 11 week old Ins2Akita mice. The scotopic threshold response was measured in diabetic Ins2Akita mice after 6-7 weeks of hyperglycemia (n=20), and compared to wild-type litter mates (n=19). Flash intensities of 0.00001 and 0.00005 c.s/m2 are considered to be in the scotopic range. The higher flash intensities presented here mark the first positive peak, but will also include bipolar cell signal from the encroaching b-wave. (A) The positive scotopic threshold response (pSTR) amplitude was smaller in hyperglycemic mice compared to wild-type littermates (*p<0.05). (B) The amplitude of the negative scotopic threshold response (nSTR) was not significantly different in the diabetic Ins2Akita mice compared to wild-type controls. The significantly reduced amplitude at flash intensity of 0.0005 c.s/ m2 is outside the scotopic range and may represent a difference in the regular ERG response (*p<0.05). |