 |
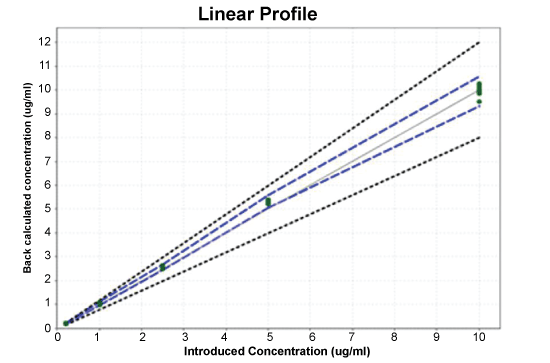
| Figure 6: Linear profile of the analytical method for the determination of HF in human ureter extracts using a linear regression model as calibration curve.The dashed limits on this graph correspond to the accuracy profile, i.e. the expectation tolerance limits expressed in absolute values. The dotted curves represent the acceptance limit at ± 20% expressed in the amount unit. The continuous line is the identify line y=x. |