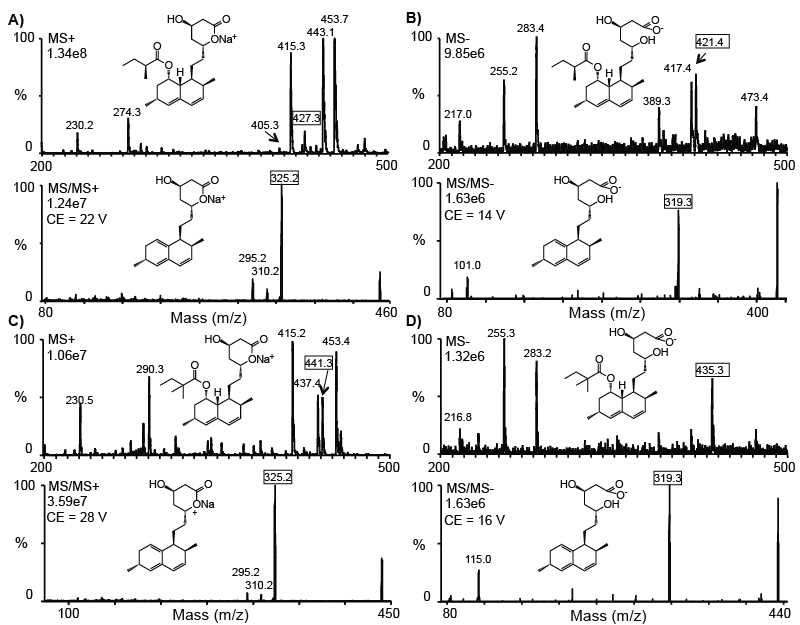
The precursor and product ion pairs selected for MRM detection are shown in boxes. The postulated structure of each also is depicted. The signal intensity for the most intense peak is in the upper-left corner of each spectrum. CE, collision energy.
 |
| Figure 1: Q1 full-scan mass spectra (MS) and product ion mass spectra (MS/MS) of LV (A) and LVA (B), and the internal standards SV (C) and SVA (D) The precursor and product ion pairs selected for MRM detection are shown in boxes. The postulated structure of each also is depicted. The signal intensity for the most intense peak is in the upper-left corner of each spectrum. CE, collision energy. |