 |
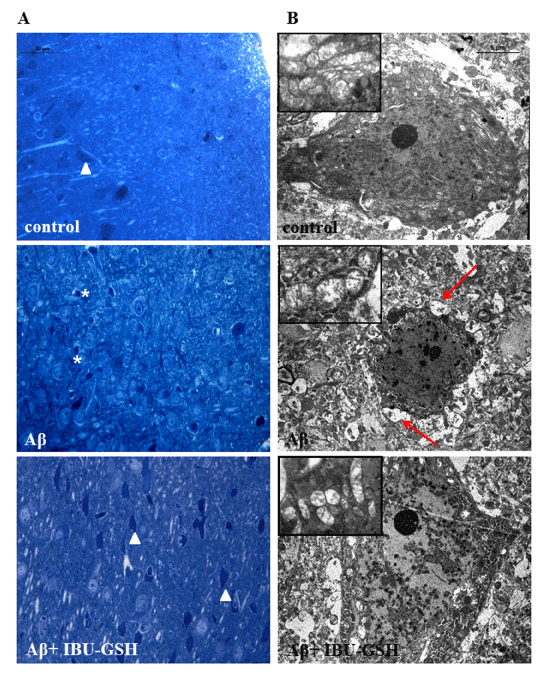
| Figure 4: A: Toluidine blue stained semi-thin rat cerebral cortex sections in different experimental conditions. Scale bar size 50 μm. B: Transmission electron microscopy analysis of rat cerebral cortex in different experimental conditions. Scale bar size 5 μm. Control: untreated sample; Aβ: Aβ-injected cerebral cortex; Aβ+IBU-GSH: Aβ-injected cerebral cortex+IBU-GSH conjugate. Asterisks indicate collapsed pyramidal pyknotic cells, arrows indicate damaged mitochondria in Aβ sample, arrow heads indicate normal neurons. Inserts show higher magnification of regular and not interrupted mitochondrial cristae in control sample, an evident mitochondria enlargement and cristae interruption in Aβ sample, and a restoration of basal situation is detectable in Aβ+IBU-GSH sample |