 |
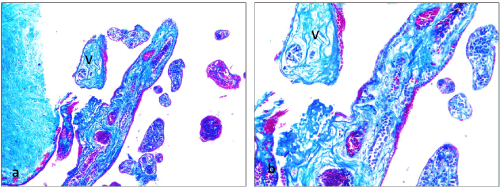
| Figure 7: A photomicrograph of diabetic group of human placentas showing; a) increased amount of interstitial collagen & Villous stromal fibrosis (V), (stained blue). b) a higher magnification of Villous stroma (V) indicate increase in fibers (stained blue) (20x). |