 |
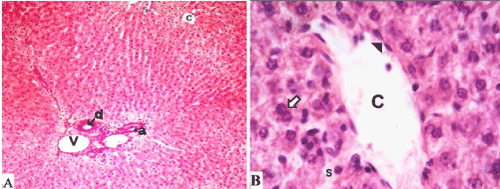
| Figure 2: A and B Control group liver sections micrographs. Normal architecture with normal hepatocytes cords around central veins (C) and sinusoids (S). Intact normal endothelium (arrowhead) appeared lining central veins, sinusoids and branches of portal vein (V) and hepatic artery (a), and the bile duct (d) showed intact and regular epithelium. Hepatocytes appeared with eosinophilic cytoplasm, vesicular nuclei and prominent nucleoli while some hepatocytes appeared binucleated (white arrow). (100X for Figure A and 1000X - oil immersion - for Figure B, Hx& E). |