 |
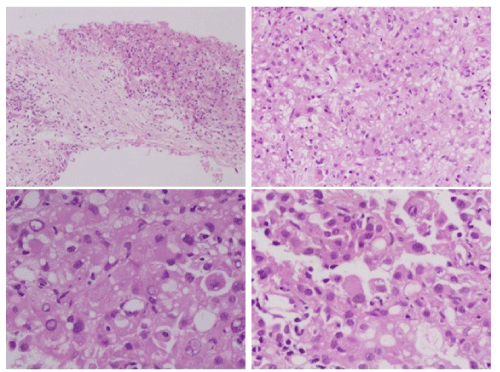
| Figure 3: (A) Low power photomicrograph of the core biopsy showing nodules of tumor cells separated by fibrous septae (H and E, 10x). (B) Sheet like arrangement of tumor cells within the lobules (H and E, 20x). (C) Higher magnification showing large polygonal tumor cells with abundant cytoplasm and nuclear pseudoinclusions (H and E, 40x). (D) Rhabdoid morphology of tumor cells (H and E, 40x). |