 |
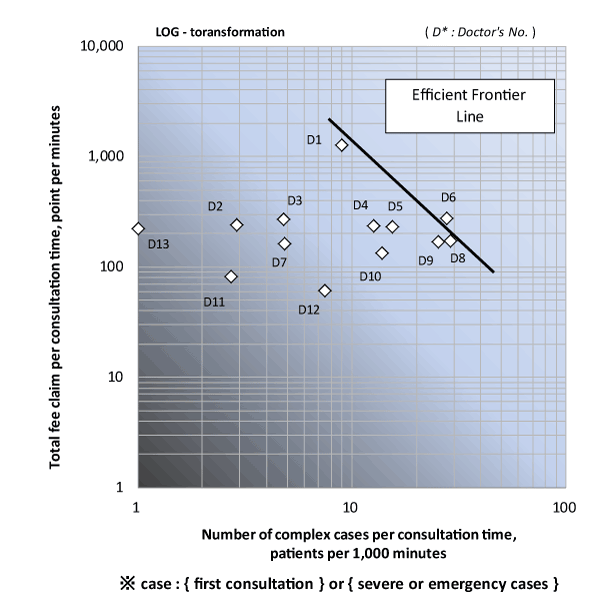
| Figure 3: Production efficiency of physicians in outpatient consultation using Data Envelopment Analysis (DEA) including clinical and economic outputs and input. Complex cases included outpatients of severe or emergency cases or first consultation. This analysis visually shows the most favorable condition for production efficiency of the physicians in outpatient consultation (production efficiency function). The figure was determined by drawing an asymptotic line from the plots of production efficiency of 4 physicians with the highest performance (D1, D6, D8, and D9). The equation enables a quantitative evaluation of how physicians other than the 4 physicians can improve their fee claims, numbers of complex cases, and consultation time (i.e., indices of the production efficiency) to maximize their performance. |