 |
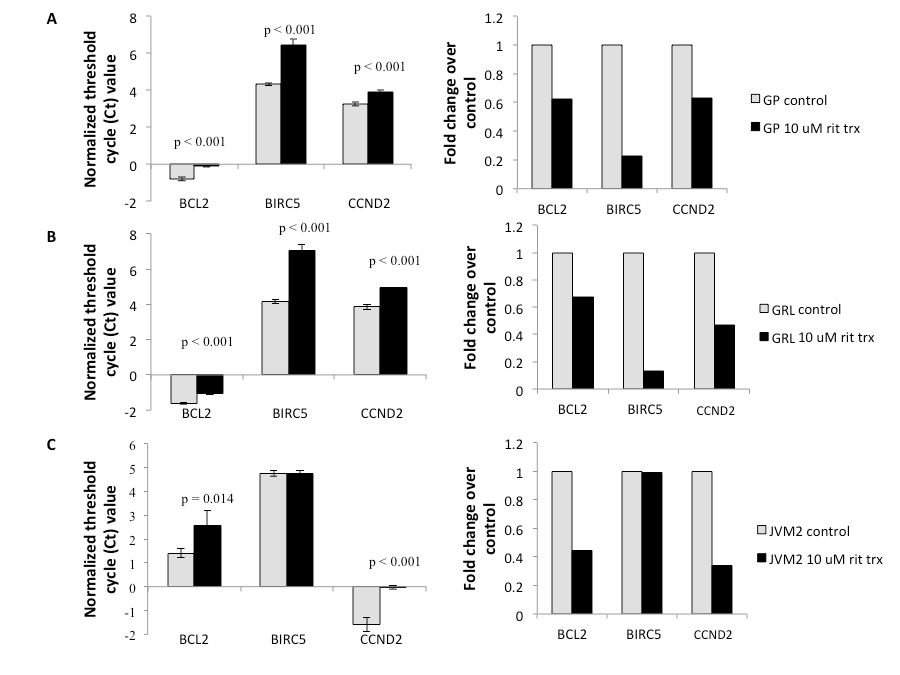
| Figure 2: Effects of ritonavir treatment on NFκB target transcripts in MCL. Effects of 6 hours treatment with 10 μM ritonavir on the mRNA expression levels of NFκB targets BCL2, BIRC5 (survivin), and CCND2 (cyclin D2) in GP (A), GRL (B), and JVM2 (C), as assessed using real time PCR. GP, GRL, and JVM2 cells (1 x 10⁶ cells) were treated with 10 μM ritonavir for 6 hours. Cells were then spun down and RNA isolated via Trizol. RNA was used for subsequent cDNA preparation and transcript-level analyses. Graphs on the left show threshold cycle (Ct) values of transcripts, normalized to the housekeeping control gene transcript HPRT. Graphs on the right show the correlative fold changes between untreated and treated cells. |