|
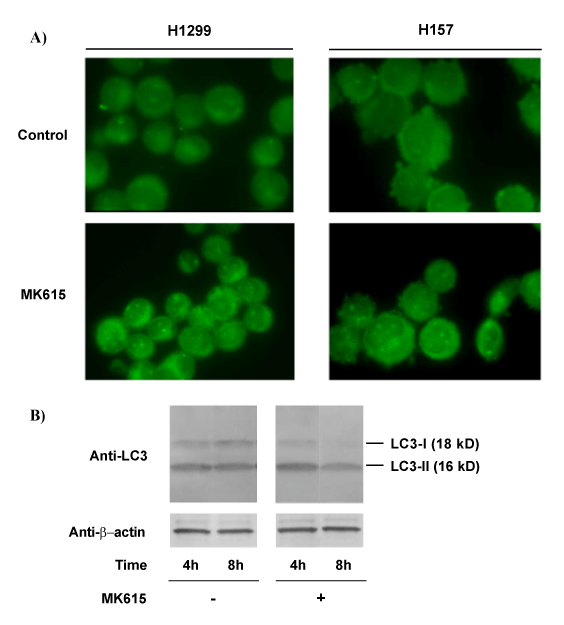
| Figure 3: (A) Autophagosome formation by MK615 treatment (10 μl/ml) in the H1299 and H157 cell lines for 6 h. An increase of LC3 expression was clearly observed after 6 h treatment in both cell lines, as compared to the nontreatment control. (B) Western blot analysis of LC3 expression in MK615- treated (10 μl/ml) and untreated H1299 cells for 4 and 8 h. The ratios of the LC3-II/LC3-I levels were increased at 4 and 8 hMK615 post-treatment, as compared to the non-treatment control. ß-Actin expression levels were used as a loading control. |