 |
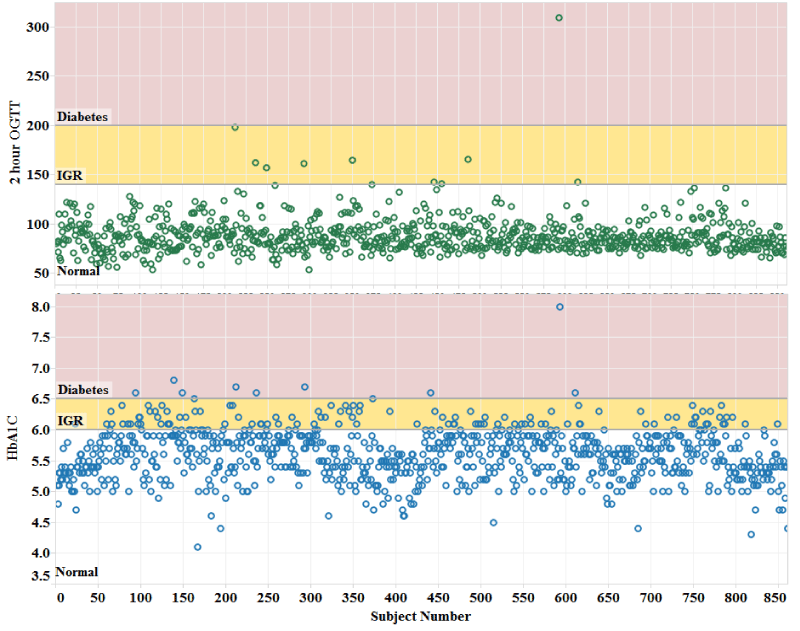
| Figure 1: Diabetic status assessment using OGTT 2-hour glucose level and HbA1c values. The X-axis represents the individual subjects and the Y-axis represents the 2 hour OGTT level (green circles) and HbA1C level (blue circles) for each subject. The assessments are shown in different color bands signifying normal (white region), IGR (orange region), and diabetic (lavender region) values for each assay. |