|
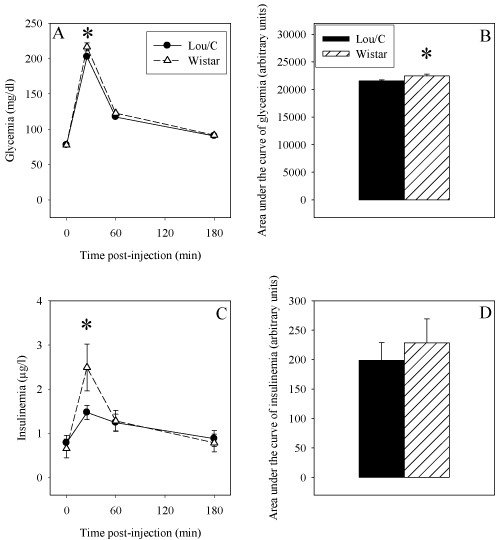
| Figure 1: Influence of increased body weight and abdominal adiposity on systemic glucose tolerance. Panel A: time-evolution of glycaemia after glucose loading; Panel B: area under the curve for glycaemia; panel C: time-evolution of insulinemia after glucose loading; panel D: area under the curve for insulinemia. There were six experiments per group. *: Significantly different. |