 |
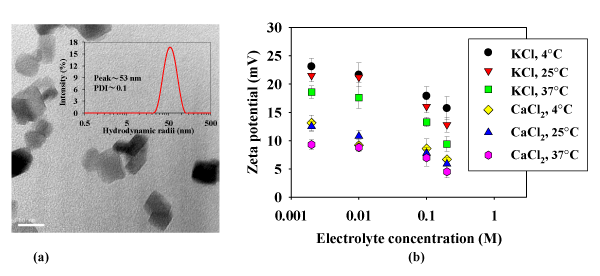
| Figure 1: Characterizations of CeO2 NPs. (a) TEM image of CeO2 NPs. The inset is the particle size distribution of 10 mg/L CeO2 NPs. The narrow particle size distribution and small PDI value imply that the NPs are relatively monodispersed. (b) Zeta potentials of CeO2 NPs under different temperatures in KCl and CaCl2 solutions. |