 |
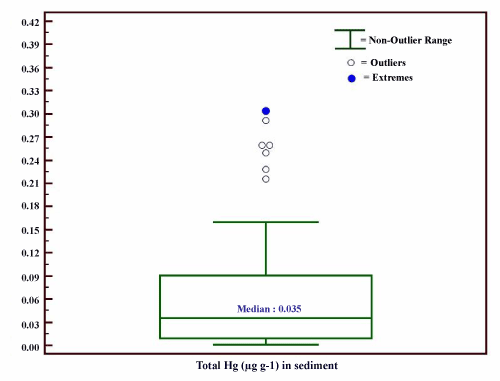
| Figure 2: Two dimensional Box Whisker Plot of total mercury concentration in the sediments of Bidyadhari river. The box whisker plot shows the interquartile range of the values. The line within the box represents the median value. White circles outside the box represent outliers (values ranging from 0.20 to 0.28) and circles topmost represents extreme values (values>0.28). |