|
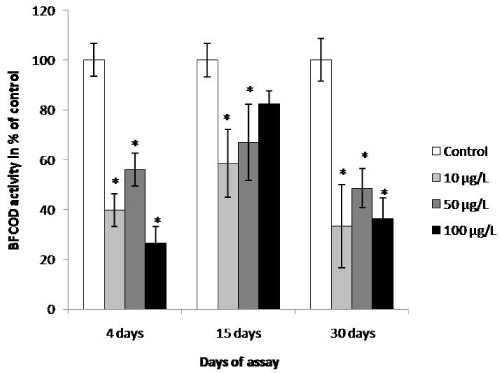
| Figure 2: Evolution of liver BFCOD activity in juvenile common carp exposed to different concentrations of carbofuran for 4, 15, and 30 days. Data represent the mean ± SE (n=7). Note: *indicates significant difference between control and pesticide group (p<0,05). |